
XY Chart NET
 XY Chart NET is a .NET chart component for Visual Studio .NET developers.
- .NET chart component for Visual Studio.NET
- Very easy to use, saves time and money
- Automatic built-in functions
- Zoom, scroll and pan
- Crosshairs and coordinates display
- Delta crosshairs
- Annotations
- Trending / data logging
- Supports multiple languages and localization
- Full unicode support
- Global number and date time formatting down to ms
- Royalty-free distribution
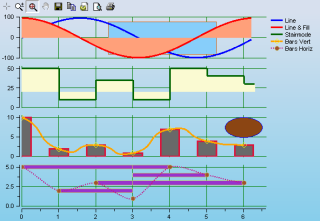
XY Chart NET provides developers with a powerful, easy-to-use XY chart component that integrates seamlessly into your Visual Studio .NET WinForms applications. Ready-to-use built-in functions include zoom, scrollbars, pan and crosshairs, which require no coding and allow users to analyze charts with ease and precision. XY Chart NET is ideally suited for technical applications as well as general application development, and is being used all over the world in a broad range of applications including scientific lab measurements, financial data, motion control, process monitoring, industrial automation, education and research, etc.