XY Chart ActiveX FAQ
1. Getting Help
You may submit questions using our support and feedback form. We will respond within 24 hours. When requesting support, please include the following:
- Name
- Business
- Version of XY Chart
- Programming language (VB6, VB.NET, MS Excel VBA or Other)
- Operating system (Windows NT / 2000 / XP / Vista or other)
- Questions and/or feedback
2. Installing from a Download
If you downloaded the trial version, no registration key is required. Simply run the installation. After 5 minutes, XY Chart will stop working and a message box will appear. Simply, stop and restart the application, and XY Chart will work for another 5 minutes.
Once you have purchased a license, you will be given a unique registration key specific to you, and you will be directed to download the full install version.
Step 1: Install XY Chart ActiveX
- Run setup.exe from the application's installation package
Step 2: Enable XY Chart ActiveX Component
- From the main menu, select Project, and then Components
- The Components window will be displayed
- Scroll down to XYChart4
- Check off XYChart4's checkbox
- Select Apply button
- XYChart4 control icon will be displayed in the Toolbox
3. Distributing XY Chart ActiveX for runtime applications
There are three typical methods to distribute XY Chart ActiveX with your application:
A. Same Directory
- Copy the xychart4.ocx file to the same directory as your main executable.
B. Manual Registration
- Copy the xychart4.ocx file to the target computer's system directory. This is usually C:\WINNT\SYSTEM32 Windows NT/2000 systems, and C:\WINDOWS\SYSTEM32 for Windows XP systems.
- Open up a command or DOS prompt or use the START/RUN command and type:
- Windows NT / 2000: regsvr32 c:\winnt\system32\xychart4.ocx
- Windows XP / Vista: regsvr32 c:\windows\system32\xychart4.ocx
C. Installer Registration
This method is the preferred option if you are planning on distributing your application to many computers or if you will be having your end users install your software on their own.
Most installation programs such as InstallShield, WISE Installer, Microsoft SMS Installer, NullSoft's Install System (Freeware), etc. can automatically register ActiveX controls for you. Refer to the installation software manufacturer's manual and help files for instructions on automatically registering ActiveX controls on your target computers. ControlEng uses the InstallShield installer to initially register your development ActiveX controls on your computer. Many corporations already have licenses for Microsoft SMS Installer, so that is generally the installer of choice for internal software distributions. If you are on a budget, NullSoft's Installer is easy to use, lightweight, and free.
Additional Files
If the user of the application does not have Visual Basic 5 or 6 installed on his computer, the following files must also be included in the distribution of XY Chart ActiveX. Distribute them in the same manner as you do for xychart4.ocx (i.e. methods A, B or C above).
- msvbvm60.dll
- comdlg32.ocx
- mscomctl.ocx
- mshflxgd.ocx
You can also use this XYChart4_4.dep dependency file with your installation.
Note for Windows XP SP2: If you are having problems registering ActiveX controls on Windows XP SP2, this is usually caused by the new security restrictions introduced in SP2. The solution is to log in as administrator and add regsvr32.exe (and possibly the ActiveX control being registered) to the Data Execution Prevention exception list (DEP OptOut list). Refer to Microsoft article http://support.microsoft.com/kb/875352 for more details.
4 . If I compile my program and distrubute only the xychart4.ocx file to my customers, do I have to pay royalties?
No. Runtime distribution licenses are free. Specifically, if you only distribute the xychart4.ocx file and do not allow your customers to develop software using XY Chart, then there are no runtime royalties.
If your customers can develop software using XY Chart, then this is effectively giving them a developer license. Therefore, in this case, a developer license must be purchased.
5 . What is the maximum size of the ChartData array?
All arrays are 0-based. The maximum number of profiles is 250000. Every point in every profile requires an X and Y value. Hence, the maximum number of columns is 2 x 250000 profiles = 500000 columns. The maximum number of samples per profile is 1000000. Therefore, the maximum size of the ChartData array is 500000 columns x 1000000 rows (see table below).
6. What is automatic zoom, scrollbars, pan, crosshairs and coordinates?
Automatic is exactly that. No programming is required. By enabling the XY Chart toolbar, the zoom, scrollbars, pan, crosshairs, and coordinates display functions are automatically available to the user.
7. What is the maximum number of Y scales, X scales and profiles?
Up to 10 Y scales and 10 X scales are available. Up to 8000 profiles can be mapped to any of the 10 Y scales and 10 X scales. For more detials, see Maximum size of the ChartData array.
8. How do I get data into XY Chart ActiveX?
There are 3 methods available to pass data to XY Chart ActiveX:
- Write each point individually using the Row, Col and Data properties
- The quickest for one or a few data points
- Slowest to change many data points
- See the Data example
- Feed one array for a single profile using ProfileData
- Passing an entire array is quicker when many data points
- Also useful when a single profile needs updating more frequently than the others
- See the ProfileData example
- Feed one array for all profiles using ChartData
- Passing an entire array is quicker when many data points
- The quickest when a lot of data points and most or all profiles have near the same NumSamples
- Also convenient if all or most data points change together
- See the ChartData example
The fasted way to pass a lot of data is using method 2 or 3. If all the values for all profiles need to be updated at the same time, then use method 3, where the dimension of the array equals the profile with the most samples. If some profiles have fewer samples, then when the array is passed to the chart, it will only get the number of samples for that profile.
9. How do I create a trending chart?
Say we want to create a trending chart with 3 profiles, and we want to store up to 60 minutes worth of data, but only display the most recent minute while actively capturing and trending the data. Let's have the data captured every second. Therefore the total number of samples is 60 mins x 60 secs/min = 3600 samples. The trend display length is 60 seconds. For this example, profile 1 will be a random generated value between 70 and 100, profile 2 will be a random generated value between 40 and 70, and profile 3 will be a random generated value between 10 and 40. See the code directly below, followed by screenshots generated by the code.
Option Explicit
Dim TrendSample as Integer
Private Sub Form_Load()
' Configure XYChart
With XYChart.NumProfiles = 3
.Trend.Enable = True
.Trend.DisplayLength = 60.NumYScales = 1
.NumXScales = 1' Colors
.YScale(1).LabelFont.Color = vbWhite
.YScale(1).TicksFont.Color = vbWhite
.XScale(1).LabelFont.Color = vbWhite
.XScale(1).TicksFont.Color = vbWhite
.BackColor = RGB(0, 40, 80)
.Plot.BackColor = RGB(203, 203, 228)' Profile 1 formatting
.Profile(1).YScale = 1
.Profile(1).Label = "Random 1"
.Profile(1).LineOption = loCustom
.Profile(1).LineWidth = woOnePoint
.Profile(1).LineStyle = soSolid
.Profile(1).MarkerOption = loNone
.Profile(1).LineColor = RGB(255, 0, 0)
.Profile(1).NumSamples = 3600' Profile 2 formatting
.Profile(2).YScale = 1
.Profile(2).Label = "Random 2"
.Profile(2).LineOption = loCustom
.Profile(2).LineWidth = woOnePoint
.Profile(2).LineStyle = soSolid
.Profile(2).MarkerOption = loNone
.Profile(2).LineColor = RGB(0, 0, 255)
.Profile(2).NumSamples = 3600' Profile 3 formatting
.Profile(3).YScale = 1
.Profile(3).Label = "Random 3"
.Profile(3).LineOption = loCustom
.Profile(3).LineWidth = woOnePoint
.Profile(3).LineStyle = soSolid
.Profile(3).MarkerOption = loNone
.Profile(3).LineColor = RGB(255, 255, 0)
.Profile(3).NumSamples = 3600End With
End Sub
' Add new trend data on Timer Event
Private Sub Timer1_Timer()
' Array dimensions are (Rows, Cols) where we are adding one row containing X1, Y1, X2, Y2, X3 and Y3.
Dim NewData (1 to 1, 1 to 6) as SingleConst NumNewSamples as Integer = 1 ' Add one row of data Note: .AddData allows for multiple rows
SampleNum = SampleNum + 1
' Capture values
NewData(1,1) = TrendSample
NewData(1,2) = 30 * Rnd + 70
NewData(1,3) = TrendSample
NewData(1,4) = 30 * Rnd + 40
NewData(1,5) = TrendSample
NewData(1,6) = 30 * Rnd + 10With XYChart
' Once we caputre the data, we need one line to feed the data into XYChart
.Trend.AddData NumNewSamples, NewData, aoAppendToEnd.Refresh ' Refresh the chart display
End With
End Sub
In the first 20 seconds of trending, the chart looks like this...
Then, during trending, the most current 60 samples (Trend.DisplayLength) are shown.
When the trending is stopped by the user, the X scale scroll bar appears.
Finally, if the user selects the Zoom out all button in the toolbar, the XYChart displays all data in the ChartData array.
10. How do I use XY Chart ActiveX in Excel VBA?
Create a named range in Excel by selecting Insert > Define > Name. Then name the range "Data". Then in the VBA code editor, map the named range into XYChart by
XYChart.ChartData = Names("Data").RefersToRange.Value
XYChart.Refresh
Note that you must ensure that the dimensions of the named range and XYChart are consistent. Specifically:
XYChart.NumSamples = Rows in the named range
XYChart.NumProfiles = (Columns in the named range) / 2
Checkout the Five Minute Demo of XY Chart Excel VBA tutorial which walks you through configuring XYChart, and displaying a named range of cells in MS Excel.
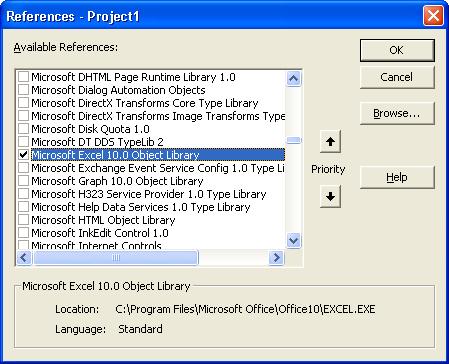
11. How do I connect to a named range in Excel from Visual Basic?
First we need to add a reference to the Microsoft Excel Office library. Do this by:
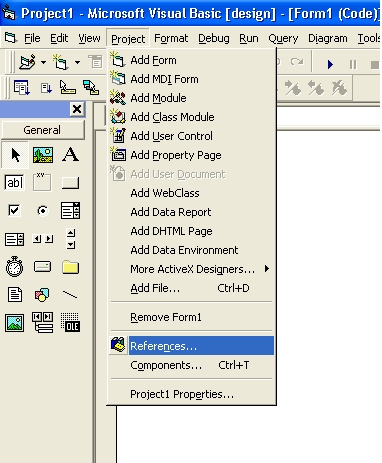
Then by selecting the Microsoft Excel Object library. Note 9.0 is for Excel 2000, and 10.0 is for Excel XP.
Once we have added the Excel object library reference to our project, then we can refer to it in our application.
Let's say we have a spreadsheet named "Demo.xls", located at "C:\Demo.xls". It contains the named range "Data".
Then we add the following code in the VB project:
' Declarations
Public appExcel As Excel.Application
Public wbDemo As Workbook
' Load Excel Application
Set appExcel = CreateObject("Excel.Application")
' Load Workbook
Set wbDemo = appExcel.Workbooks.Open(C:\Demo.xls")
' Map the named range into XYChart
XYChart.ChartData = wbDemo.Names("Data").RefersToRange.Value
XYChart.Refresh
' Close the Workbook and end Excel
wbDemo.Close
appExcel.Quit
Set appExcel = Nothing ' Free unused memory
Note that you must ensure that the dimensions of the named range and XYChart are consistent. Specifically:
XYChart.NumSamples = Rows in the named range
XYChart.NumProfiles = (Columns in the named range) / 2
Tip: If you want to hide Excel so the user cannot see or run your version of Excel, i.e. run Excel in the background, and have VB as the only interface, insert the line below before you load the workbook
' Block user from running my version of Excel
appExcel.IgnoreRemoteRequests = True
12. How do I use DateTime formatting?
DateTime support allows the display of date and/or time values to be displayed on any X or Y axis. The DateTime format is implemented as a floating-point value (double), measuring days from midnight, December 30, 1899. So, midnight, December 31, 1899 is represented by 1.0. Similarly, 6 AM, January 1, 1900 is represented by 2.25.
XY Chart lists a number of Date, Time and DateTime formats in the drop down on the X and Y-Axes property page (X Axes shown below). This is only a small sample of the many possible format strings. Any combination of the codes can be used to create specific date time formats.
Note that the '.fff' format denotes miliseconds, which is the smallest DateTime number format supported.
E.g. For a value of 38045.40279, the format strings below yield the following results:
| Format String | Result |
|---|---|
| h:mm:ss | 9:40:00 |
| hh:mm:ss.fff | 09:40:00.056 |
| hh:mm:ss AMPM | 09:40:00 AM |
| m/d/yy |
2/28/04 |
| dd-mmm-yyyy | 28-Feb-2004 |
| mmmm dd, yyyy hh:mm:ss AMPM | February 28, 2004 09:40:00 AM |
' The X scale formatting can also be set programitically as per the following:
With XYChart
.XScale(1).FormatStyle = fsDateTime
.XScale(1).DateTimeFormat = "dd-mmm-yyyy hh:mm:ss AMPM" ' X value = 38045.40279 will display 28-Feb-2004 09:40:00 AM
End With
13 . How do I print charts?
Print functionality is built into XY Chart ActiveX. The chart image is scaled to fit the printable area based on the paper size and the PrinterSettings properties - left, top, right and bottom margins and orientation (portrait or landscape). The aspect ratio (height-to-width) is maintained. The print dialog appears if PrintSettings.ShowDialog = True.
With XYChartCtrl
.PrintSettings.LeftMargin = 1 ' 1 inch left margin
.PrintSettings.TopMargin = 1 ' 1 inch top margin
.PrintSettings.RightMargin = 1 ' 1 inch right margin
.PrintSettings.BottomMargin = 1 ' 1 inch bottom margin
.PrintSettings.Orientation = poLandscape ' Landscape orientation
.PrintSettings.ShowDialog = True ' Print dialog will be displayed when the PrintChart method is called or the Print toolbar button is selected
.PrintChart
End With
14 . How do I get the mouse icon to change when dragging a scale?
Dragging the scales directly is only permitted when the scale is zoomed in and the corresponding scrollbar visible property is false. I.e. If the horizontal scrollbar is not visible, then X Scale dragging is permitted. Likewise, if the vertical scrollbar is not visible, then Y Scale dragging is permitted. Copy this hand icon file into the same directory as your application and use the following code for the PlotMouseMove, YScaleMouseMove and XScaleMouseMove events.
' Y Scales
Private Sub XYChart4Ctl1_YScaleMouseMove(Button As Integer, Index As Integer, xPos As Single, yPos As Single)
With XYChart4Ctl1
If Not .ScrollBars.VerticalVisible And (.MinYValue(Index) > .AbsMinYValue(Index) Or .MaxYValue(Index) < .AbsMaxYValue(Index)) Then
Dim dScaleMargin As Double
Dim YStack As Integer
dScaleMargin = 20
YStack = GetYStackGivenYScale(Index)
If xPos < .YStack(YStack).Left - dScaleMargin And yPos > .YStack(YStack).Top + dScaleMargin And _
yPos < (.YStack(YStack).Top + .YStack(YStack).Height - dScaleMargin) Then
If Me.MousePointer <> vbCustom Then
Me.MousePointer = vbCustom
If Button <> vbLeftButton Then
Me.MouseIcon = LoadPicture(App.Path + "\Hand.ico")
End If
End If
Else
If Me.MousePointer <> vbDefault Then Me.MousePointer = vbDefault
End If
Else
If Me.MousePointer <> vbDefault Then Me.MousePointer = vbDefault
End IfEnd With
End Sub
' X Scales
Private Sub XYChart4Ctl1_XScaleMouseMove(Button As Integer, Index As Integer, xPos As Single, yPos As Single)
With XYChart4Ctl1
If Not .ScrollBars.HorizontalVisible And (.MinXValue(Index) > .AbsMinXValue(Index) Or .MaxXValue(Index) < .AbsMaxXValue(Index)) Then
Dim dScaleMargin As Double
dScaleMargin = 20
If xPos > (.YStack(1).Left + dScaleMargin) And xPos < (.YStack(1).Left + .YStack(1).Width) And _
yPos > (.YStack(Index).Top + .YStack(Index).Height + dScaleMargin) Then
If Me.MousePointer <> vbCustom Then
Me.MousePointer = vbCustom
If Button <> vbLeftButton Then
Me.MouseIcon = LoadPicture(App.Path + "\Hand.ico")
End If
End If
Else
If Me.MousePointer <> vbDefault Then Me.MousePointer = vbDefault
End If
Else
If Me.MousePointer <> vbDefault Then Me.MousePointer = vbDefault
End IfEnd With
End Sub
' Get YStack Given YScale
Private Function GetYStackGivenYScale(YScale As Integer) As Integer
Dim YStack As Integer
Dim YScaleCount As IntegerWith XYChart4Ctl1
If .YStacking = True Then
For YStack = 1 To .NumYStacks
YScaleCount = YScaleCount + .YStack(YStack).NumYScales
If YScaleCount >= YScale Then
GetYStackGivenYScale = YStack
Exit For
End If
Next YStack
Else
GetYStackGivenYScale = 1
End IfEnd With
End Function
' Reset mouse pan icon to default
Private Sub XYChart4Ctl1_PlotMouseMove(Button As Integer, Index As Integer, xPos As Single, yPos As Single)
Me.MousePointer = vbDefault
End Sub
15. How do I get the X & Y values when the PlotMouseMove, PlotMouseDown & PlotMouseUp events fire?
The code shown below is for the PlotMouseMove event. It applies equally to the PlotMouseDown and PlotMouseUp events. It will calculate the X and Y values for any axis, and accounting for a linear or log scale.
Worth noting that YStack(YScale) gives the position and dimensions of the corresponding plot area. If YStacking = False, then there is only one plot area.
Private Sub XYChart4Ctl1_PlotMouseMove(Button As Integer, Index As Integer, xPos As Single, yPos As Single)
With XYChart4Ctl1
Const YScaleRM As Integer = 1 ' Right most Y scale (must be 1 to determine X values)
Dim YScale As Integer, XScale As Integer, YScaleStack As Integer
Dim dXValue As Double, dYValue As DoubleXScale = 1 ' Change this value to any available XScale
If .YStacking Then
YScale = Index ' Uses Index to determine the appropriate YScale
YScaleStack = YScale
Else
YScale = 1 ' Change this value to any available YScale
YScaleStack = 1 ' Only 1 plot area when YStacking = False
End If' Determine X & Y values
If .XScale(XScale).ScaleType = stLinear Then
' Linear X Scale
dXValue = (xPos + Screen.TwipsPerPixelX - .YStack(YScaleRM).Left) / .YStack(YScaleRM).Width * _
(.MaxXValue(XScale) - .MinXValue(XScale)) + .MinXValue(XScale)
Else
' Log X Scale
dXValue = 10 ^ ((xPos + Screen.TwipsPerPixelX - .YStack(YScaleRM).Left) / .YStack(YScaleRM).Width * _
(Log(.MaxXValue(XScale)) / Log(10) - Log(.MinXValue(XScale)) / Log(10)) + Log(.MinXValue(XScale)) / Log(10))
End IfIf .YScale(YScale).ScaleType = stLinear Then
' Linear Y Scale
dYValue = .MaxYValue(YScale) - (yPos - .YStack(YScaleStack).Top) / .YStack(YScaleStack).Height * _
(.MaxYValue(YScale) - .MinYValue(YScale))
Else
' Log Y Scale
dYValue = 10 ^ (Log(.MaxYValue(YScale)) / Log(10) - (yPos - .YStack(YScaleStack).Top) / .YStack(YScaleStack).Height * _
(Log(.MaxYValue(YScale)) / Log(10) - Log(.MinYValue(YScale)) / Log(10)))
End IfEnd With
End Sub
16. Why can't I register ActiveX controls on Windows XP SP2?
This is usually caused by the new security restrictions introduced in SP2. The solution is to log in as administrator and add regsvr32.exe (and possibly the ActiveX control being registered) to the Data Execution Prevention exception list (DEP OptOut list). Refer to Microsoft article http://support.microsoft.com/kb/875352 for more details.
18. How do I swap X and Y scales?
Swap X and Y scales by calling this routine:
Private Sub SwapScales()
' Function applies to charts with 1 X Scale and 1 x Y Scale only
Dim arrXData As Variant
Dim arrYData As Variant
Dim XLabel As String
Dim YLabel As String
Dim ProfileNum As IntegerWith XYChart4Ctl1
For ProfileNum = 1 To .NumProfiles
' Profile Data
arrXData = .ProfileXData(ProfileNum)
arrYData = .ProfileYData(ProfileNum).ProfileXData(ProfileNum) = arrYData
.ProfileYData(ProfileNum) = arrXData
Next ProfileNum' Scale Labels
XLabel = .XScale(1).Label
YLabel = .YScale(1).Label.XScale(1).Label = YLabel
.YScale(1).Label = XLabel.Refresh
End With
End Sub
19. Can profiles be displayed while their corresponding Y Scale is not?
Yes. Each Y Scale can be made visible or hidden independent of the profiles mapped to it. The toolbar can also be hidden. This is usually done to save space, allowing the plot area to be larger. All scaling functions continue to work as though the Y Scale is displayed. See sample images below.
Y Scales Visible
Y Scales and Toolbar Hidden
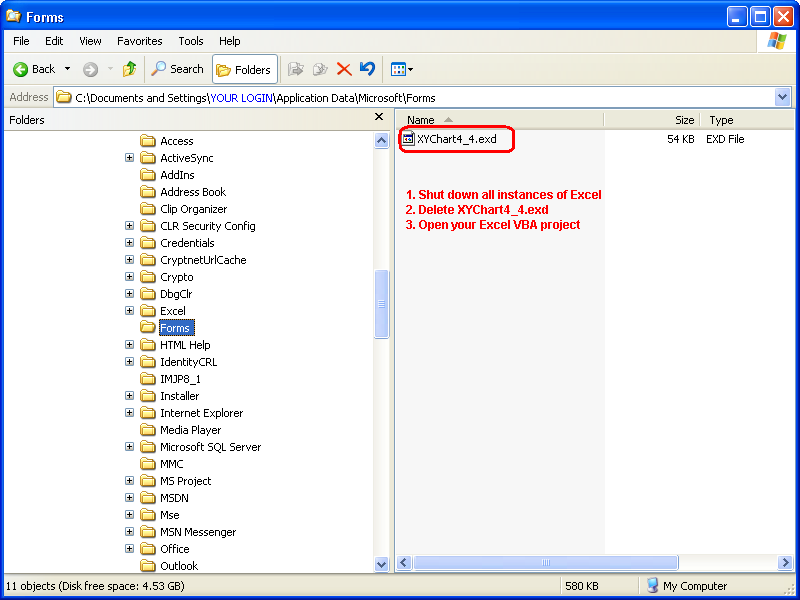
20. I have an Excel VBA application and I get the "cannot insert object" error. How do I fix this?
This is a common problem experienced by XY Chart ActiveX users with Excel VBA. The typical sequence of events goes likes this... The Excel VBA application is first tested and/or developed using the XY Chart ActiveX Trial version. Then the XY Chart ActiveX Full version is purchased and installed, and the next time the Excel VBA application is opened, VBA displays the "cannot insert object" error. This is caused by the remanence of the Trial version control in the ..\Application Data\Microsoft\Forms folder.
To reset the XY Chart ActiveX settings for Excel VBA, follow the 3 steps in the image below. And if you cannot find XYChart4_4.exd, perform a file search for XYChart4_4.exd, and make sure to allow the search for system folders, hidden files and folders, etc.