SampleStep
SampleStep feature allows you to specify the Step value in the loop that draws a profile. If SampleStep is 2, every other data point is plotted for the specific profile. Increasing the SampleStep property decreases the refresh time by not having to plot every profile value. Increase SampleStep when Profile(x).NumSamples is large and when displaying every value is not important. When the user zooms in deep enough, change the Profile(x).SampleStep value to 1 when the ZoomInSelected event fires.
See Figures 1, 2 and 3 examples below. Note: All graphs below display the same 100,000 data points.
Figure 1: SampleStep = 10, ZoomOutAll
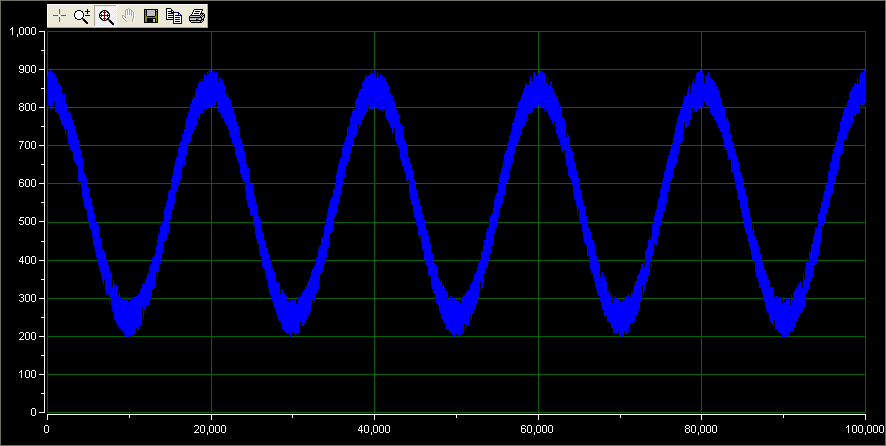
' Sample code for chart above
With XYChartCtrl1
.Profile(1).SampleStep = 10
End With
Figure 2: SampleStep = 10, ZoomIn
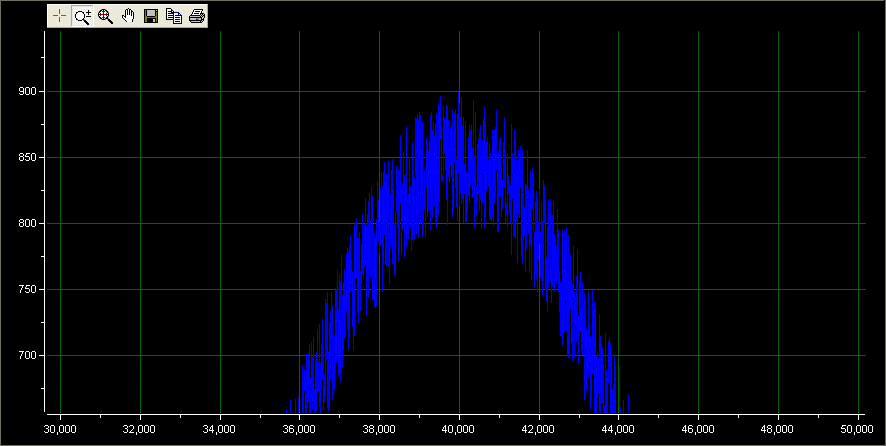
' Sample code for chart above
With XYChartCtrl1
.Profile(1).SampleStep = 10
End With
Figure 3: SampleStep = 1, ZoomIn Further
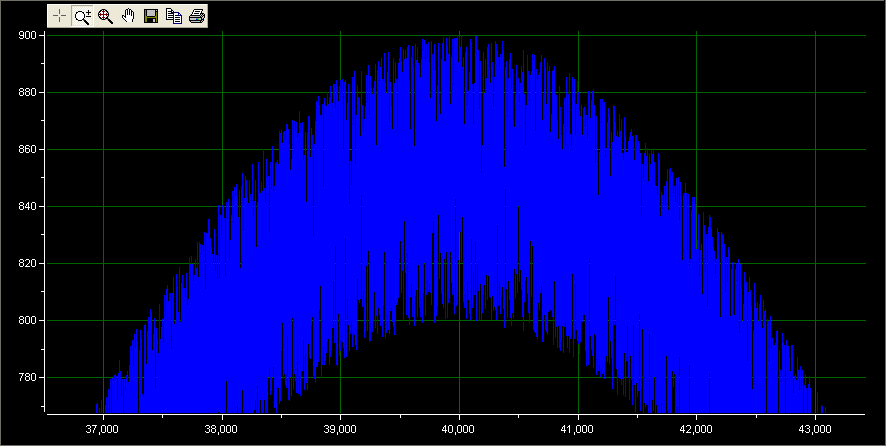
' Sample code for chart above
With XYChartCtrl1
.Profile(1).SampleStep = 1
End With
See the ProfileClass for more details.