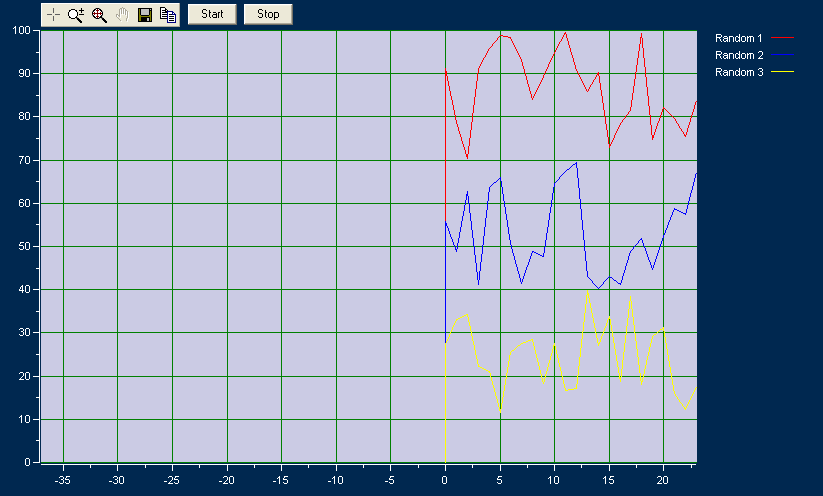
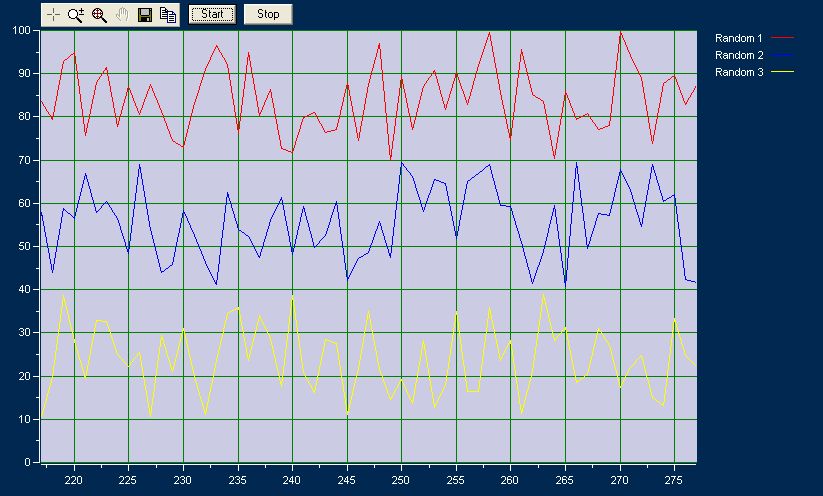
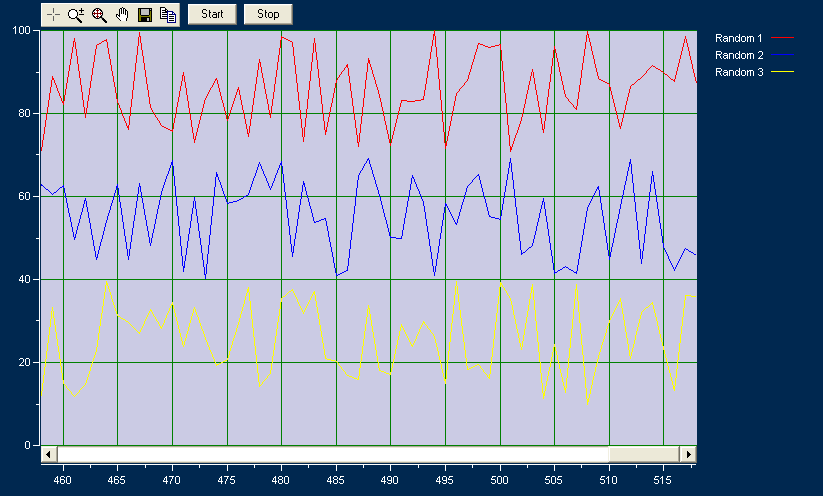
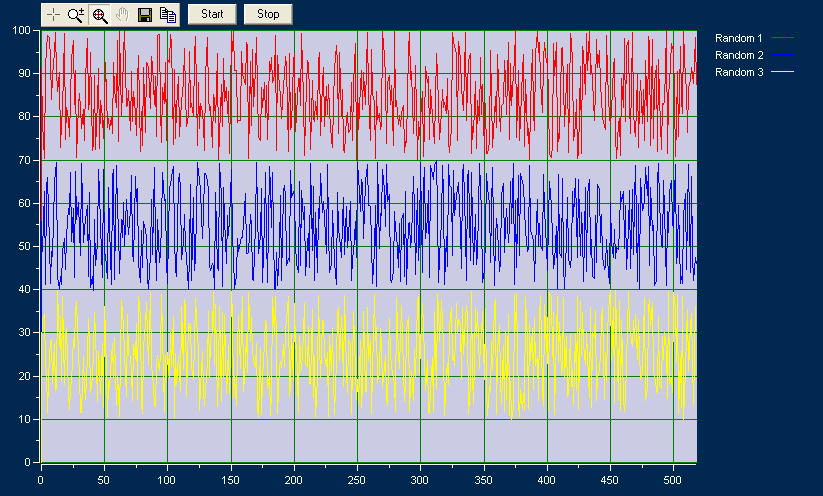
'
To test this code, the trial or full version of XYChart must be
installed on your computer.
' 1. Start a new standard Visual Basic project
' 2. Copy the code below directly into the project
' 3. On the form, place a new XYChart control named XYChart4Ctl1
(default)
' 4. On the form, add two command buttons names Command1 and Command2
(defaults)
' 5. On the form, add one timer control named Timer1 (default)
' 6. Run the project
Option
Explicit
Dim TrendSample As Integer
Private
Sub Form_Load()
Command1.Caption = "Start"
Command2.Caption = "Stop"
Command1.ZOrder
Command2.ZOrder
' Configure XYChart control
With XYChart4Ctl1
.NumProfiles
= 3
.Trend.Enable
= True
.Trend.DisplayLength
= 60
.NumYScales
= 1
.Legend.Visible
= True
.Legend.BorderVisible
= False
.Legend.YScaleVisible
= False
.Toolbar.Visible
= True
.YGrid(1).LineOption
= loCustom
.YGrid(1).LineStyle
= soSolid
.YGrid(1).LineColor
= RGB(0, 128, 0)
.XGrid(1).LineOption
= loCustom
.XGrid(1).LineStyle
= soSolid
.XGrid(1).LineColor
= .YGrid(1).LineColor
'
Y Scale
.YScale(1).Visible
= True
.YScale(1).ScaleMode
= smManual
.YScale(1).Max
= 100
.YScale(1).Min
= 0
.YScale(1).Label
= ""
.YScale(1).LabelFont.Color
= vbWhite
.YScale(1).TicksFont.Color
= vbWhite
'
X Scale
.XScale(1).ScaleMode
= smAuto
.XScale(1).Label
= ""
.XScale(1).TicksFont.Color
= vbWhite
.BackColor =
RGB(0, 40, 80)
.Plot.BackColor
= RGB(203, 203, 228)
.Plot.Border.LineOption
= loNone
.Plot.Border.LineWidth
= woOnePoint
.Plot.Border.LineColor
= RGB(0, 128, 0)
'
Format Profile 1
.Profile(1).YScale
= 1
.Profile(1).Label
= "Random 1"
.Profile(1).LineOption
= loCustom
.Profile(1).LineWidth
= woOnePoint
.Profile(1).LineStyle
= soSolid
.Profile(1).MarkerOption
= loNone
.Profile(1).LineColor
= RGB(255, 0, 0)
.Profile(1).NumSamples
= 3600
'
Format Profile 2
.Profile(2).YScale
= 1
.Profile(2).Label
= "Random 2"
.Profile(2).LineOption
= loCustom
.Profile(2).LineWidth
= woOnePoint
.Profile(2).LineStyle
= soSolid
.Profile(2).MarkerOption
= loNone
.Profile(2).LineColor
= RGB(0, 0, 255)
.Profile(2).NumSamples
= 3600
'
Format Profile 3
.Profile(3).YScale
= 1
.Profile(3).Label
= "Random 3"
.Profile(3).LineOption
= loCustom
.Profile(3).LineWidth
= woOnePoint
.Profile(3).LineStyle
= soSolid
.Profile(3).MarkerOption
= loNone
.Profile(3).LineColor
= RGB(255, 255, 0)
.Profile(3).NumSamples
= 3600
.ClearChartData
'
Format Crosshairs
.CrossHairs.Color
= RGB(0, 128, 0)
.CrossHairs.Width
= woThreePoint
.CrossHairs.HorizontalVisible
= False
.CrossHairs.YCoordInLegend
= True
.CrossHairs.CoordsBackcolor
= RGB(0, 128, 0)
.Refresh
End With
' Start timer
Timer1.Interval = 100
Timer1.Enabled = True
End
Sub
' Timer Event
Private Sub Timer1_Timer()
Dim NewData(1 To 1, 1 To 6) As Variant
NewData(1, 1) = TrendSample
NewData(1, 2) = 30 * Rnd + 70
NewData(1, 3) = TrendSample
NewData(1, 4) = 30 * Rnd + 40
NewData(1, 5) = TrendSample
NewData(1, 6) = 30 * Rnd + 10
'
Add new trend data to chart array
With XYChart4Ctl1
.Trend.AddData
1, NewData, aoAppendToEnd
.Refresh
End With
TrendSample = TrendSample + 1
End Sub
'
Start trending
Private Sub Command1_Click()
Timer1.Enabled = True
With
XYChart4Ctl1
.Trend.Enable
= True
.Refresh
End With
End Sub
'
Stop trending
Private Sub Command2_Click()
Timer1.Enabled = False
With XYChart4Ctl1
.Trend.Enable
= False
.Refresh
End With
End Sub
'
Resize Event
Private Sub Form_Resize()
Command1.Top = 60
Command1.Left = 3200
Command1.Width = 735
Command1.Height = 315
Command2.Top = 60
Command2.Left = Command1.Left + Command1.Width + 120
Command2.Width = 735
Command2.Height = 315
With XYChart4Ctl1
.Left = 0
.Top = 0
.Width =
Me.ScaleWidth
.Height =
Me.ScaleHeight
.Refresh
End With
End Sub


