XY Chart NET 3 Control Reference
Interpolation

| XY Chart NET 3 Control Reference > Features > Interpolation |
XY Chart NET provides numerous options for visually displaying data.
| Scatter | To simply display data points on the graph, set the profile's MarkerOption to custom. Refer to Profile for other profile properties to set. | |
| Line | To display line segments connecting data points, set the profile's LineOption to custom. Refer to Profile for other profile properties to set. | |
| Line with Data Markers | To display both data point markers and line segments connecting the data points, set the profile's LineOption to custom and MarkerOption to custom. Refer to Profile for other profile properties to set. | |
| Spline | To display both data point markers and curved line segments connecting the data points, set the profile's LineOption to custom, MarkerOption to custom, and SplineTension to a value between 0 and 1. If SplineTension equals 0, straight line segments will be drawn. Refer to Profile for other profile properties to set. | |
| Stair Mode | To display the data points in a step fashion, set the profile's LineOption to custom and StairMode to true. To also display markers for the data points, set the profile's MarkerOption to custom. Refer to Profile for other profile properties to set. | |
| Fill | To fill a profile to a reference line, set the profile's FillEnabled to True, and FillReference to the reference line value. This example has FillReference set to 15. Refer to Profile for other profile properties to set. | |
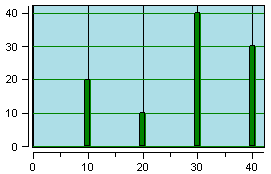
| Bar | 
|
To display each data point as a bar, set the profile's ChartFeatureType to bar, LineOption to none, and MarkerOption to none. Refer to Profile for other profile properties to set. |
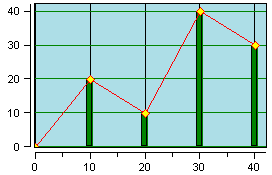
| Bar with Line and Data Markers | 
|
To display each data point as a bar as well as display both data point markers and line segments connecting the data points, set the profile's ChartFeatureType to bar, LineOption to custom, and MarkerOption to custom. Refer to Profile for other profile properties to set. |
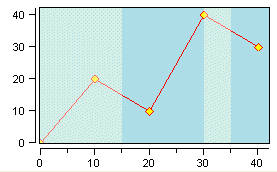
| Recession | 
|
To display recession periods (shaded regions), set the profile's ChartFeatureType to Recession, and FillEnabled to True. Refer to Profile for other profile properties to set. Also, refer to Recession Sample for a code example. |
| Candle | To display Open, High, Low and Close data per data sample, set the profile's ChartFeatureType to Candle. Refer to Profile for other profile properties to set. Also, refer to Candle Sample for a code example. |