XY Chart NET 3 Control Reference
Sample 3: NULL Data Points

| XY Chart NET 3 Control Reference > Samples > Sample 3: NULL Data Points |
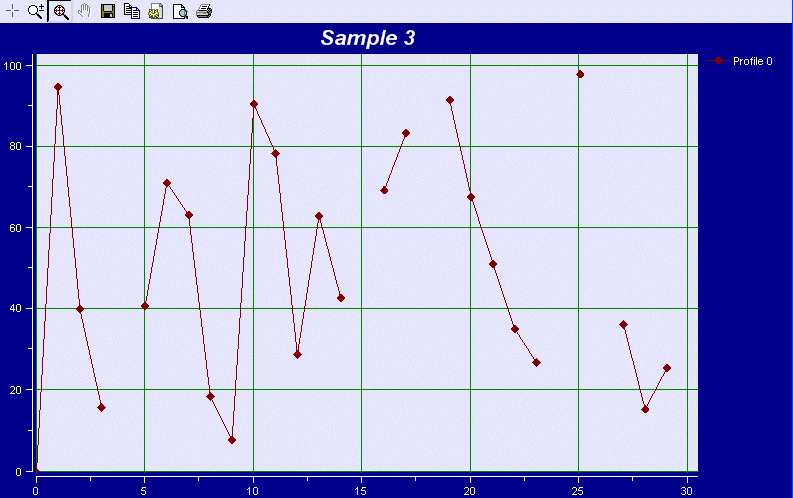
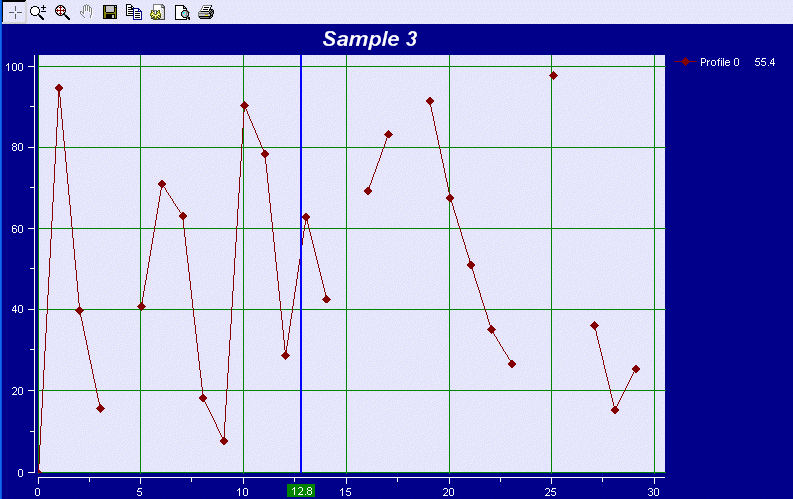
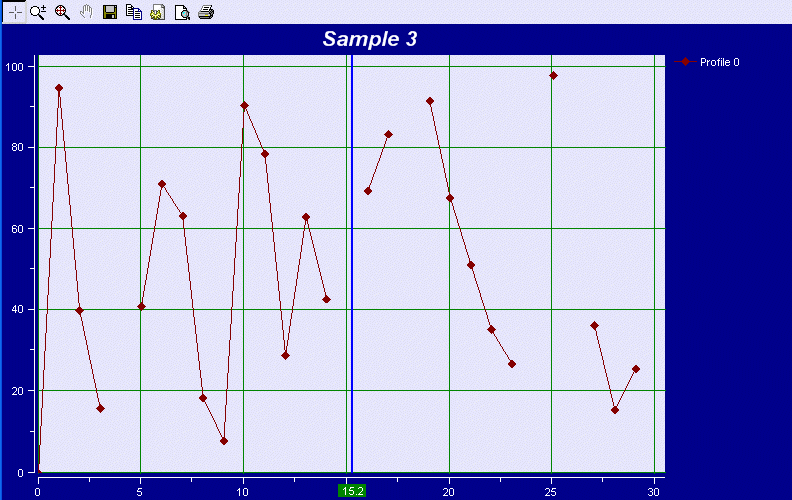
This sample demonstrates how to omit certain data points from being plotted on the chart by setting its value to NULL. Null Data Points occur when the y-value = 1.79 * 10 ^ 308. Snapshots of the resulting chart are included below.
To test this code, the trial or full version of XY Chart NET must be installed on your computer.
Private Sub Form1_Load(ByVal sender As System.Object, ByVal e As System.EventArgs) Handles MyBase.Load
   Dim myFont As New Font("Arial", 16, FontStyle.Italic Or FontStyle.Bold)
   Dim i As Integer
   Dim ChartData(,) As Double

   Const NullDataValue As Double = 1.79 * 10 ^ 308

   ' Configure XY Chart NET control
   With XyChartNETCtl1
      .NumProfiles = 1
      .NumXScales = 1
      .NumYScales = 1

      .Title.Label = "Sample 3"
      .Title.Font = myFont
      .Title.Color = Color.White

      ' Toolbar
      .Toolbar.Visible = True
      .Toolbar.BackColor = Color.Lavender

      ' Format Legend
      .Legend.Visible = True
      .Legend.BorderVisible = False
      .Legend.YScaleVisible = False

      ' X Axis
      With .XAxis(0)
         With .Grid
            .LineOption = XYChartNet.XYChartNETCtl.LineOptions.loCustom
            .LineColor = Color.Green
         End With
         With .Scale
            .Visible = True
            .Label = ""
            .LabelColor = Color.White
            .TicksColor = Color.White
            .ScaleMode = XYChartNet.XYChartNETCtl.ScaleModes.smAuto
         End With
      End With

      ' Y Axis
      With .YAxis(0)
         With .Grid
            .LineOption = XYChartNet.XYChartNETCtl.LineOptions.loCustom
            .LineColor = Color.Green
         End With
         With .Scale
            .Visible = True
            .Label = ""
            .LabelColor = Color.White
            .TicksColor = Color.White
            .ScaleMode = XYChartNet.XYChartNETCtl.ScaleModes.smAuto
         End With
      End With

      ' Chart & plot formatting
      .BackColor = Color.DarkBlue
      .Plot.BackColor = Color.Lavender
      .Plot.Border.LineOption = XYChartNet.XYChartNETCtl.LineOptions.loNone

      ' Format Profile 0
      With .Profile(0)
         .XScale = 0
         .YScale = 0
         .Label = "Profile 0"
         .LineOption = XYChartNet.XYChartNETCtl.LineOptions.loCustom
         .LineWidth = XYChartNet.XYChartNETCtl.WidthOptions.woOnePoint
         .LineStyle = XYChartNet.XYChartNETCtl.StyleOptions.soSolid
         .LineColor = Color.Maroon
         .MarkerOption = XYChartNet.XYChartNETCtl.LineOptions.loCustom
         .MarkerStyle = XYChartNet.XYChartNETCtl.MarkerStyleOptions.msDiamond
         .MarkerSize = 4
         .MarkerFillColor = Color.Maroon
         .MarkerBorderColor = Color.Maroon
         .NumSamples = 30
      End With

      ' Create random chart data, then feed into XYChartNET
      ReDim ChartData(.Profile(0).NumSamples - 1, 2 * .NumProfiles - 1)
      For i = 0 To .Profile(0).NumSamples - 1
         ChartData(i, 0) = i * 1
         If i = 0 Then
            ChartData(i, 1) = 0 ' Force first y value to zero
         Else
            If Rnd() <= 0.2 Then ' Set random null values 20% of time
               ChartData(i, 1) = NullDataValue
            Else
               ChartData(i, 1) = 100 * Rnd()
            End If
         End If
      Next i
      .ChartData = ChartData

      ' Format Crosshairs
      With .Crosshairs
         .YCoordInLegend = True
         .Color = Color.Blue
         .Width = XYChartNet.XYChartNETCtl.WidthOptions.woTwoPoint
         .CoordsBackcolor = Color.Green
         .HorizontalVisible = False
         .VerticalVisible = True
      End With

      .Refresh()
   End With
End Sub


'Resize Event
Private Sub Form1_Resize(ByVal sender As Object, ByVal e As System.EventArgs) Handles MyBase.Resize
   With XyChartNETCtl1
      .Left = 0
      .Top = 0
      .Width = Me.ClientRectangle.Width
      .Height = Me.ClientRectangle.Height
   End With
End Sub
// NOTE:  Set the XYChartNET control's Anchor property to 'Top, Bottom, Left, Right'.
// Add the following code after the call to InitializeComponent in public Form1()

    const int    myNumSamples = 30;
    const int    myXYSet = 2;

    double [,] ChartData = new double [myNumSamples, myXYSet];
    Font       myFont    = new Font("Arial", 16, FontStyle.Bold | FontStyle.Italic);
    double     NullDataValue = 1.79 * Math.Pow(10, 308);

    // Configure XY Chart NET control
    XYChartNETCtl1.NumProfiles = 1;
    XYChartNETCtl1.NumXScales = 1;
    XYChartNETCtl1.NumYScales = 1;

    XYChartNETCtl1.BackColor = Color.DarkBlue;

    // Legend
    XYChartNETCtl1.Legend.Visible = true;
    XYChartNETCtl1.Legend.BorderVisible = false;
    XYChartNETCtl1.Legend.YScaleVisible = false;

    XYChartNETCtl1.Title.Label = "Sample 3";
    XYChartNETCtl1.Title.Font = myFont;
    XYChartNETCtl1.Title.Color = Color.White;

    // Toolbar
    XYChartNETCtl1.Toolbar.Visible = true;
    XYChartNETCtl1.Toolbar.BackColor = Color.Lavender;

    // Crosshairs
    XYChartNETCtl1.Crosshairs.YCoordInLegend = true;
    XYChartNETCtl1.Crosshairs.Color = Color.Blue;
    XYChartNETCtl1.Crosshairs.Width = XYChartNet.XYChartNETCtl.WidthOptions.woTwoPoint;
    XYChartNETCtl1.Crosshairs.CoordsBackcolor = Color.Green;
    XYChartNETCtl1.Crosshairs.HorizontalVisible = false;
    XYChartNETCtl1.Crosshairs.VerticalVisible = true;

    // Plot formatting
    XYChartNETCtl1.Plot.BackColor = Color.Lavender;
    XYChartNETCtl1.Plot.Border.LineOption = XYChartNet.XYChartNETCtl.LineOptions.loNone;

    // X Axis Grid & Scale properties
    XYChartNet.XYChartNETCtl.XSCALEPROP xAxis;
    xAxis = XYChartNETCtl1.get_XAxis(0);
    xAxis.Grid.LineOption = XYChartNet.XYChartNETCtl.LineOptions.loCustom;
    xAxis.Grid.LineColor = Color.Green;
    xAxis.Scale.Label = "";
    xAxis.Scale.LabelColor = Color.White;
    xAxis.Scale.TicksColor = Color.White;
    xAxis.Scale.ScaleMode = XYChartNet.XYChartNETCtl.ScaleModes.smAuto;

    // Y Axis Grid & Scale properties
    XYChartNet.XYChartNETCtl.YSCALEPROP yAxis;
    yAxis = XYChartNETCtl1.get_YAxis(0);
    yAxis.Grid.LineOption = XYChartNet.XYChartNETCtl.LineOptions.loCustom;
    yAxis.Grid.LineColor = Color.Green;
    yAxis.Scale.Label = "";
    yAxis.Scale.LabelColor = Color.White;
    yAxis.Scale.TicksColor = Color.White;
    yAxis.Scale.ScaleMode = XYChartNet.XYChartNETCtl.ScaleModes.smAuto;

    // Profile 0
    XYChartNet.XYChartNETCtl.C_Profile profile;
    profile = XYChartNETCtl1.get_Profile(0);
    profile.XScale = 0;
    profile.YScale = 0;
    profile.Label = "Profile 0";
    profile.LineOption = XYChartNet.XYChartNETCtl.LineOptions.loCustom;
    profile.LineWidth = XYChartNet.XYChartNETCtl.WidthOptions.woOnePoint;
    profile.LineStyle = XYChartNet.XYChartNETCtl.StyleOptions.soSolid;
    profile.LineColor = Color.Maroon;
    profile.MarkerOption = XYChartNet.XYChartNETCtl.LineOptions.loCustom;
    profile.MarkerStyle = XYChartNet.XYChartNETCtl.MarkerStyleOptions.msDiamond;
    profile.MarkerSize = 4;
    profile.MarkerFillColor = Color.Maroon;
    profile.MarkerBorderColor = Color.Maroon;
    profile.NumSamples = myNumSamples;

    // Create random chart data, then feed into XYChartNET
    Random rnd = new Random();
    for (int i = 0; i < myNumSamples; i++)
    {
        ChartData[i, 0] = i * 1;
        if (i == 0)
            ChartData[i, 1] = 0;            // Force first y value to zero
        else
        {
            if (rnd.NextDouble() <= 0.2)    // Set random null values 20% of time
                ChartData[i, 1] = NullDataValue;
            else
                ChartData[i, 1] = 100 * rnd.NextDouble();
        }
    }
    XYChartNETCtl1.ChartData = ChartData;

    XYChartNETCtl1.Refresh();
// NOTE:  Set the XYChartNET control's Anchor property to 'Top, Bottom, Left, Right'.
// Add the following code after the call to InitializeComponent in public Form1()

    const int    myNumSamples = 30;
    const int    myXYSet = 2;

    double                  ChartData __gc[,] = new double __gc[myNumSamples, myXYSet];
    int                     myFontStyle = (int)Drawing::FontStyle::Bold | (int)Drawing::FontStyle::Italic;
    System::Drawing::Font*  myFont = new Drawing::Font("Arial", 16, (Drawing::FontStyle)myFontStyle);
    double                  NullDataValue = 1.79 * Math::Pow(10, 308);

    // Configure XY Chart NET control
    XYChartNETCtl1->NumProfiles = 1;
    XYChartNETCtl1->NumXScales = 1;
    XYChartNETCtl1->NumYScales = 1;

    XYChartNETCtl1->BackColor = Color::DarkBlue;

    // Legend
    XYChartNETCtl1->Legend->Visible = true;
    XYChartNETCtl1->Legend->BorderVisible = false;
    XYChartNETCtl1->Legend->YScaleVisible = false;

    XYChartNETCtl1->Title->Label = "Sample 3";
    XYChartNETCtl1->Title->Font = myFont;
    XYChartNETCtl1->Title->Color = Color::White;

    // Toolbar
    XYChartNETCtl1->Toolbar->Visible = true;
    XYChartNETCtl1->Toolbar->BackColor = Color::Lavender;

    // Crosshairs
    XYChartNETCtl1->Crosshairs->YCoordInLegend = true;
    XYChartNETCtl1->Crosshairs->Color = Color::Blue;
    XYChartNETCtl1->Crosshairs->Width = XYChartNETCtl::WidthOptions::woTwoPoint;
    XYChartNETCtl1->Crosshairs->CoordsBackcolor = Color::Green;
    XYChartNETCtl1->Crosshairs->HorizontalVisible = false;
    XYChartNETCtl1->Crosshairs->VerticalVisible = true;

    // Plot formatting
    XYChartNETCtl1->Plot->BackColor = Color::Lavender;
    XYChartNETCtl1->Plot->Border->LineOption = XYChartNETCtl::LineOptions::loNone;

    // Format grid lines
    XYChartNETCtl1->get_XAxis(0).Grid->LineOption = XYChartNETCtl::LineOptions::loCustom;
    XYChartNETCtl1->get_XAxis(0).Grid->LineColor = Color::Green;
    XYChartNETCtl1->get_YAxis(0).Grid->LineOption = XYChartNETCtl::LineOptions::loCustom;
    XYChartNETCtl1->get_YAxis(0).Grid->LineColor = Color::Green;

    // X Scale
    XYChartNETCtl1->get_XAxis(0).Scale->Label = "";
    XYChartNETCtl1->get_XAxis(0).Scale->LabelColor = Color::White;
    XYChartNETCtl1->get_XAxis(0).Scale->TicksColor = Color::White;
    XYChartNETCtl1->get_XAxis(0).Scale->ScaleMode = XYChartNETCtl::ScaleModes::smAuto;

    // Y Scale
    XYChartNETCtl1->get_YAxis(0).Scale->Label = "";
    XYChartNETCtl1->get_YAxis(0).Scale->LabelColor = Color::White;
    XYChartNETCtl1->get_YAxis(0).Scale->TicksColor = Color::White;
    XYChartNETCtl1->get_YAxis(0).Scale->ScaleMode = XYChartNETCtl::ScaleModes::smAuto;

    // Profile 0
    XYChartNETCtl1->get_Profile(0)->XScale = 0;
    XYChartNETCtl1->get_Profile(0)->YScale = 0;
    XYChartNETCtl1->get_Profile(0)->LineOption = XYChartNETCtl::LineOptions::loCustom;
    XYChartNETCtl1->get_Profile(0)->LineWidth = XYChartNETCtl::WidthOptions::woOnePoint;
    XYChartNETCtl1->get_Profile(0)->LineStyle = XYChartNETCtl::StyleOptions::soSolid;
    XYChartNETCtl1->get_Profile(0)->LineColor = Color::Maroon;
    XYChartNETCtl1->get_Profile(0)->MarkerOption = XYChartNETCtl::LineOptions::loCustom;
    XYChartNETCtl1->get_Profile(0)->MarkerStyle = XYChartNETCtl::MarkerStyleOptions::msDiamond;
    XYChartNETCtl1->get_Profile(0)->MarkerSize = 4;
    XYChartNETCtl1->get_Profile(0)->MarkerFillColor = Color::Maroon;
    XYChartNETCtl1->get_Profile(0)->MarkerBorderColor = Color::Maroon;
    XYChartNETCtl1->get_Profile(0)->Label = "Profile 0";
    XYChartNETCtl1->get_Profile(0)->NumSamples = myNumSamples;

    // Create random chart data, then feed into XYChartNET
    for (int i = 0; i < myNumSamples; i++)
    {
        ChartData[i, 0] = i * 1;
        if (i == 0)
            ChartData[i, 1] = 0;            // Force first y value to zero
        else
        {
            if (rnd->NextDouble() <= 0.2)   // Set random null values 20% of time
                ChartData[i, 1] = NullDataValue;
            else
                ChartData[i, 1] = 100 * rnd->NextDouble();
        }
    }
    XYChartNETCtl1->ChartData = ChartData;

    XYChartNETCtl1->Refresh();


