XY Chart NET 3 Control Reference
Sample 7: Profile Fill
| XY Chart NET 3 Control Reference > Samples > Sample 7: Profile Fill |
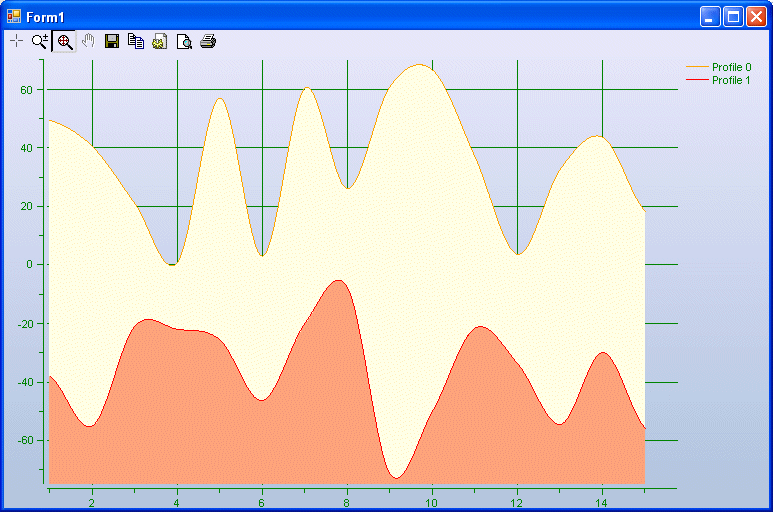
This sample demonstrates how to chart profile data using the Profile Fill feature. Profile Fill allows you to fill in the area between the profile line and a reference line with a specified color.
This chart shows two random profiles, each set to use the Profile Fill feature. Both profiles are using y=-75 as its reference line. A snapshot of the resulting chart is included below.
To test this code, the trial or full version of XY Chart NET must be installed on your computer.
    Private Sub Form1_Load(ByVal sender As System.Object, ByVal e As System.EventArgs) Handles MyBase.Load
        Dim i As Short
        Dim ChartData(,) As Double

        With XyChartNETCtl1
            .NumProfiles = 2
            .NumYScales = 1
            .NumXScales = 1

            .Toolbar.BackColor = Color.Lavender
            .Toolbar.Visible = True

            .BackColor = Color.Lavender

            .Plot.BackColor = Color.Transparent
            .Plot.Border.LineOption = XYChartNet.XYChartNETCtl.LineOptions.loNone

            .Scrollbars.HorizontalVisible = False
            .Scrollbars.VerticalVisible = False

            With .Gradient
                .GradientOption = XYChartNet.XYChartNETCtl.GradientOptions.goCustom
                .Orientation = XYChartNet.XYChartNETCtl.OrientationOptions.ooVertical
                .StartColor = Color.Lavender
                .EndColor = Color.LightSteelBlue
            End With

            With .Legend
                .Visible = True
                .BorderVisible = False
                .YScaleVisible = False
            End With

            ' Crosshairs
            With .Crosshairs
                .YCoordInLegend = False
                .Color = Color.Black
                .Width = XYChartNet.XYChartNETCtl.WidthOptions.woTwoPoint
                .HorizontalVisible = False
                .CoordsBackcolor = Color.Yellow
                .YCoordInLegend = True
            End With

            With .YAxis(0)
                With .Grid
                    .LineOption = XYChartNet.XYChartNETCtl.LineOptions.loCustom
                    .LineColor = Color.Green
                End With
                With .Scale
                    .Label = ""
                    .TicksColor = Color.Green
                    .LabelColor = Color.Green
                    .Visible = True
                End With
            End With

            With .XAxis(0)
                With .Grid
                    .LineOption = XYChartNet.XYChartNETCtl.LineOptions.loCustom
                    .LineColor = Color.Green
                End With
                With .Scale
                    .Label = ""
                    .TicksColor = Color.Green
                    .LabelColor = Color.Green
                    .Visible = True
                End With
            End With

            ' Profile 1
            With .Profile(0)
                .YScale = 0
                .XScale = 0
                .NumSamples = 15
                .LineOption = XYChartNet.XYChartNETCtl.LineOptions.loCustom
                .LineColor = Color.Orange
                .MarkerOption = XYChartNet.XYChartNETCtl.LineOptions.loNone
                .Label = "Profile 0"
                .SplineTension = 0.5
                .FillEnabled = True
                .FillReference = -75
                .FillColor = Color.LightYellow
            End With

            ' Profile 2
            With .Profile(1)
                .YScale = 0
                .XScale = 0
                .NumSamples = 15
                .LineOption = XYChartNet.XYChartNETCtl.LineOptions.loCustom
                .LineColor = Color.Red
                .MarkerOption = XYChartNet.XYChartNETCtl.LineOptions.loNone
                .Label = "Profile 1"
                .SplineTension = 0.5
                .FillEnabled = True
                .FillReference = -75
                .FillColor = Color.LightSalmon
            End With

            ' Populate array, then feed into XYChartNET.ChartData
            ReDim ChartData(.Profile(0).NumSamples - 1, 2 * .NumProfiles - 1)
            For i = 0 To .Profile(0).NumSamples - 1
                ChartData(i, 0) = (i + 1) * 1
                ChartData(i, 1) = 70 * Rnd()

                ChartData(i, 2) = ChartData(i, 0)
                ChartData(i, 3) = 70 * Rnd() - 75
            Next i

            .ChartData = ChartData
            .Refresh()

        End With

    End Sub
private void Form1_Load(object sender, EventArgs e)
{
    const int    myNumSamples = 15;
    const int    myXYSet = 4;

    int     i;
    double [,] ChartData = new double [myNumSamples, myXYSet];

    // Configure XY Chart NET control
    xyChartNETCtl1.NumProfiles = 2;
    xyChartNETCtl1.NumYScales = 1;
    xyChartNETCtl1.NumXScales = 1;

    xyChartNETCtl1.Toolbar.BackColor = Color.Lavender;
    xyChartNETCtl1.Toolbar.Visible = true;

    xyChartNETCtl1.BackColor = Color.Lavender;

    xyChartNETCtl1.Plot.BackColor = Color.Transparent;
    xyChartNETCtl1.Plot.Border.LineOption = XYChartNet.XYChartNETCtl.LineOptions.loNone;

    xyChartNETCtl1.Scrollbars.HorizontalVisible = false;
    xyChartNETCtl1.Scrollbars.VerticalVisible = false;

    xyChartNETCtl1.Gradient.GradientOption = XYChartNet.XYChartNETCtl.GradientOptions.goCustom;
    xyChartNETCtl1.Gradient.Orientation = XYChartNet.XYChartNETCtl.OrientationOptions.ooVertical;
    xyChartNETCtl1.Gradient.StartColor = Color.Lavender;
    xyChartNETCtl1.Gradient.EndColor = Color.LightSteelBlue;

    xyChartNETCtl1.Legend.Visible = true;
    xyChartNETCtl1.Legend.BorderVisible = false;
    xyChartNETCtl1.Legend.YScaleVisible = false;

    // Crosshairs
    xyChartNETCtl1.Crosshairs.YCoordInLegend = false;
    xyChartNETCtl1.Crosshairs.Color = Color.Black;
    xyChartNETCtl1.Crosshairs.Width = XYChartNet.XYChartNETCtl.WidthOptions.woTwoPoint;
    xyChartNETCtl1.Crosshairs.HorizontalVisible = false;
    xyChartNETCtl1.Crosshairs.CoordsBackcolor = Color.Yellow;
    xyChartNETCtl1.Crosshairs.YCoordInLegend = true;

    xyChartNETCtl1.get_YAxis(0).Grid.LineOption = XYChartNet.XYChartNETCtl.LineOptions.loCustom;
    xyChartNETCtl1.get_YAxis(0).Grid.LineColor = Color.Green;
    xyChartNETCtl1.get_YAxis(0).Scale.Label = "";
    xyChartNETCtl1.get_YAxis(0).Scale.TicksColor = Color.Green;
    xyChartNETCtl1.get_YAxis(0).Scale.LabelColor = Color.Green;
    xyChartNETCtl1.get_YAxis(0).Scale.Visible = true;

    xyChartNETCtl1.get_XAxis(0).Grid.LineOption = XYChartNet.XYChartNETCtl.LineOptions.loCustom;
    xyChartNETCtl1.get_XAxis(0).Grid.LineColor = Color.Green;
    xyChartNETCtl1.get_XAxis(0).Scale.Label = "";
    xyChartNETCtl1.get_XAxis(0).Scale.TicksColor = Color.Green;
    xyChartNETCtl1.get_XAxis(0).Scale.LabelColor = Color.Green;
    xyChartNETCtl1.get_XAxis(0).Scale.Visible = true;

    // Profile 1
    xyChartNETCtl1.get_Profile(0).YScale = 0;
    xyChartNETCtl1.get_Profile(0).XScale = 0;
    xyChartNETCtl1.get_Profile(0).NumSamples = myNumSamples;
    xyChartNETCtl1.get_Profile(0).LineOption = XYChartNet.XYChartNETCtl.LineOptions.loCustom;
    xyChartNETCtl1.get_Profile(0).LineColor = Color.Orange;
    xyChartNETCtl1.get_Profile(0).MarkerOption = XYChartNet.XYChartNETCtl.LineOptions.loNone;
    xyChartNETCtl1.get_Profile(0).Label = "Profile 0";
    xyChartNETCtl1.get_Profile(0).SplineTension = 0.5F;
    xyChartNETCtl1.get_Profile(0).FillEnabled = true;
    xyChartNETCtl1.get_Profile(0).FillReference = -75;
    xyChartNETCtl1.get_Profile(0).FillColor = Color.LightYellow;

    // Profile 2
    xyChartNETCtl1.get_Profile(1).YScale = 0;
    xyChartNETCtl1.get_Profile(1).XScale = 0;
    xyChartNETCtl1.get_Profile(1).NumSamples = myNumSamples;
    xyChartNETCtl1.get_Profile(1).LineOption = XYChartNet.XYChartNETCtl.LineOptions.loCustom;
    xyChartNETCtl1.get_Profile(1).LineColor = Color.Red;
    xyChartNETCtl1.get_Profile(1).MarkerOption = XYChartNet.XYChartNETCtl.LineOptions.loNone;
    xyChartNETCtl1.get_Profile(1).Label = "Profile 1";
    xyChartNETCtl1.get_Profile(1).SplineTension = 0.5F;
    xyChartNETCtl1.get_Profile(1).FillEnabled = true;
    xyChartNETCtl1.get_Profile(1).FillReference = -75;
    xyChartNETCtl1.get_Profile(1).FillColor = Color.LightSalmon;

    // Populate array, then feed into XYChartNET.ChartData
    Random random1 = new Random();
    Random random2 = new Random();
    for (i = 0; i < myNumSamples; i++)
    {
        // Profile 1
        ChartData[i, 0] = (i + 1) * 1;
        ChartData[i, 1] = 70 * random1.NextDouble();

        // Profile 2
        ChartData[i, 2] = ChartData[i, 0];
        ChartData[i, 3] = 70 * random2.NextDouble() - 75;
    }

    // Feed source array into XYChart
    xyChartNETCtl1.ChartData = ChartData;

    xyChartNETCtl1.Refresh();
}
Display