Pump Pressure vs Flow
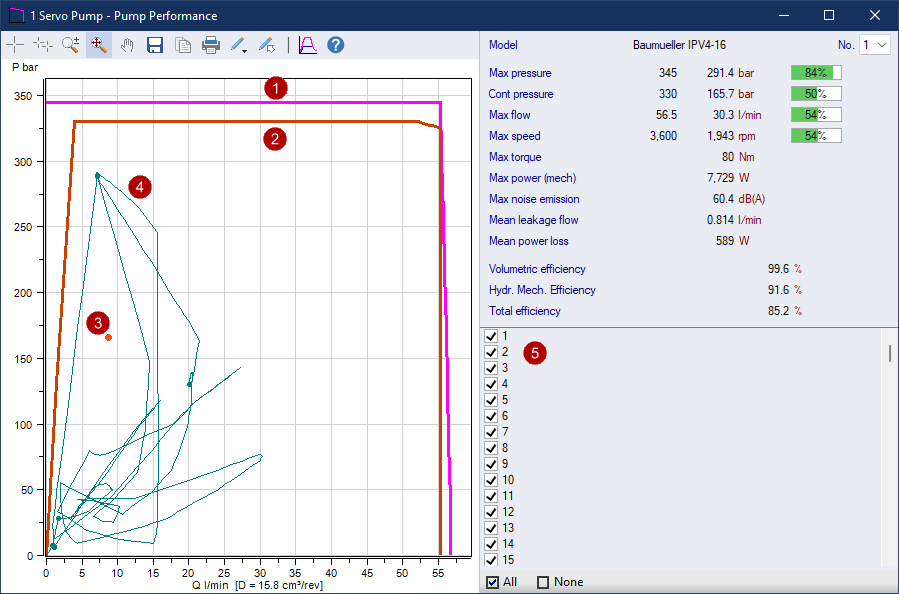
Rated pressure vs flow curve
Application Profiles
Each sequence segment is displayed
Segments shown as a dot occur when the start and end pressure and flows are the same
Show/Hide/Highlight Segments in the chart
When checked, the corresponding profiles are shown in the chart
When selected, the corresponding profiles are highlighted in the chart
Select 1 or more Segments, then right-click for the option to Show or Hide the selected Segments
Related topics
Pump
Pressure and Flow Load
Charts