Y-Scale Stacking
Y-Scale Stacking feature allows you to display one or more y-scales per plot (aka YStack). The plots are stacked vertically with the first y-stack on top, then the second, and so on.
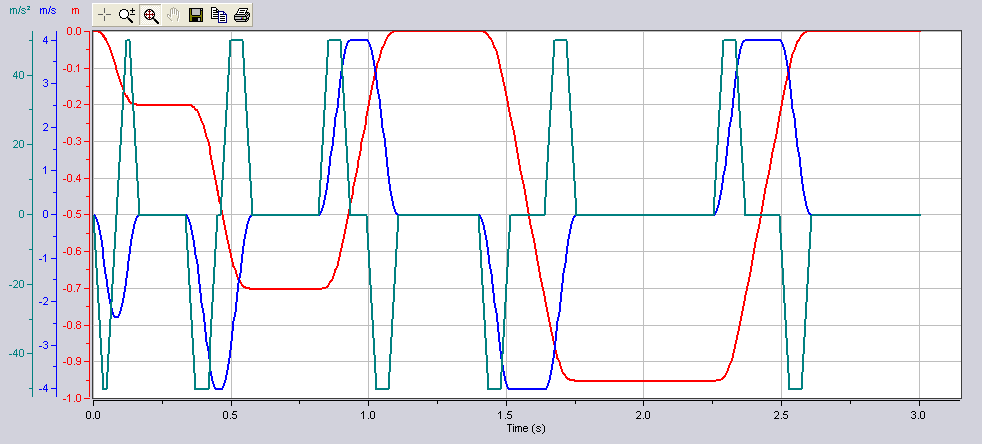
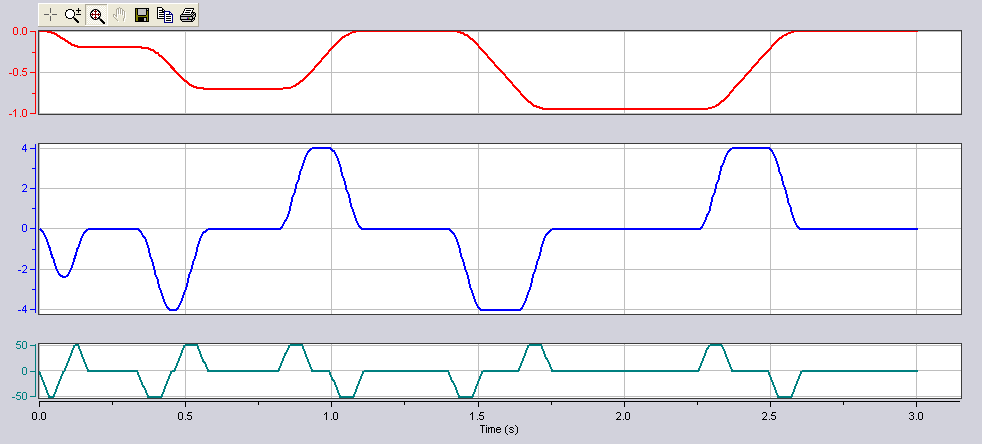
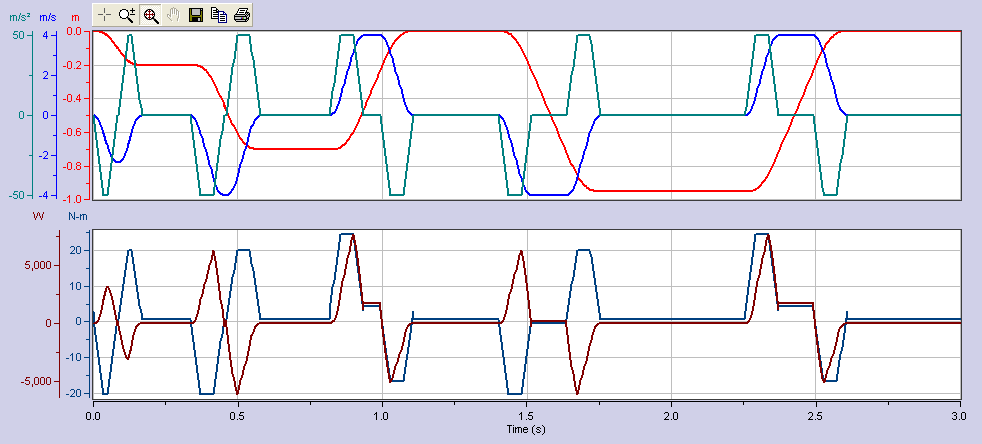
See examples in Figures 1, 2 and 3 below. Note: Figures 1 & 2 graphs display the same data.
Figure 1: Y Stacking Not Used

' Sample code for chart above
With XYChartCtrl1
.NumYScales = 3
.NumProfiles = 3
.YStacking = False
.Profile(1).YScale = 1
.Profile(2).YScale = 2
.Profile(3).YScale = 3
End With
Figure 2: Y-Scale Stacking Used (1x1x1)

' Sample code for chart above
With XYChartCtrl1
.NumYScales = 3
.NumProfiles = 3
.YStacking = True
.NumYStacks = 3
.YStack(1).NumYScales = 1
' Y-Stack 1 will contain Y-Scale 1
.YStack(2).NumYScales = 1 '
Y-Stack 2 will contain Y-Scale 2
.YStack(3).NumYScales = 1 '
Y-Stack 3 will contain Y-Scale 3
.Profile(1).YScale = 1
.Profile(2).YScale = 2
.Profile(3).YScale = 3
End With
Figure 3: Y-Scale Stacking Used (3x2)

' Sample code for chart above
With XYChartCtrl1
.NumYScales = 5
.NumProfiles = 5
.YStacking = True
.NumYStacks = 2
.YStack(1).NumYScales = 3
' Y-Stack 1 will contain Y-Scales 1, 2 and 3
.YStack(2).NumYScales = 2 '
Y-Stack 2 will contain Y-Scales 4 and 5
.Profile(1).YScale = 1
.Profile(2).YScale = 2
.Profile(3).YScale = 3
.Profile(4).YScale = 4
.Profile(5).YScale = 5
End With
NOTE: This feature is only available if the number of YScales is greater than 1.
To Enable Feature
To enable the feature programmatically, set the YStacking property. In addition, to configure the stacked graphs, set the YStack property.