'
To test this code, the trial or full version of XYChart must be installed
on your computer.
' 1. Start a new standard Visual Basic project
' 2. Copy the code below directly into the project
' 3. On the form, place a new XYChart control named XYChart4Ctl1 (default)
' 4. Run the project
Private
Sub Form_Load()
'
Configure XYChart control
With
XYChart4Ctl1
.NumProfiles
= 2
.NumYScales
= 1
.Toolbar.Visible
= True
'
Format Legend
.Legend.Visible
= True
.Legend.BorderVisible
= False
.Legend.YScaleVisible
= False
'
Format grid lines
.YGrid(1).LineOption
= loCustom
.YGrid(1).LineColor
= RGB(0, 128, 0)
.XGrid(1).LineOption
= loCustom
.XGrid(1).LineColor
= .YGrid(1).LineColor
'
X Scale
.XScale(1).Label
= "Time (ms)"
.XScale(1).LabelFont.Color
= vbBlack
.XScale(1).TicksFont.Color
= vbBlack
'
Y Scale
.YScale(1).Visible
= True
.YScale(1).Label
= "Volts"
.YScale(1).LabelFont.Color
= vbBlack
.YScale(1).TicksFont.Color
= vbBlack
'
Chart & plot formatting
.BackColor
= RGB(230, 230, 220)
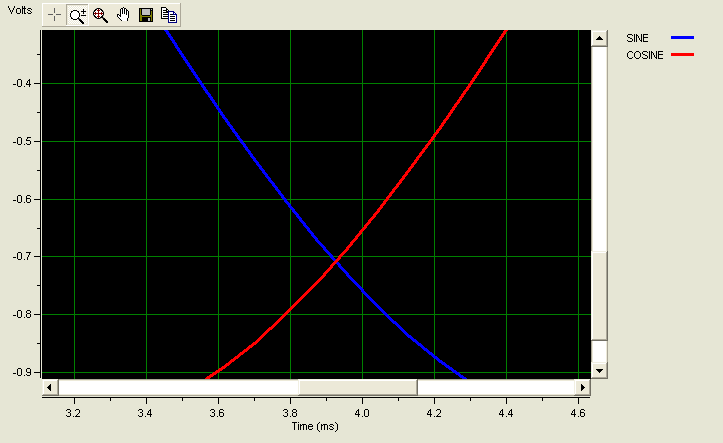
.Plot.BackColor
= vbBlack
.Plot.Border.LineOption
= loNone
'
Format Profile 1
.Profile(1).YScale
= 1
.Profile(1).LineOption
= loCustom
.Profile(1).LineWidth
= woThreePoint
.Profile(1).LineStyle
= soSolid
.Profile(1).MarkerOption
= loNone
.Profile(1).LineColor
= RGB(0, 0, 255)
.Profile(1).Label
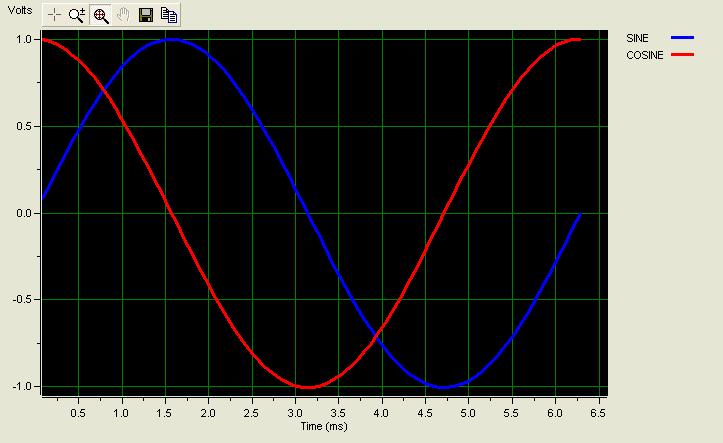
= "SINE"
.Profile(1).NumSamples
= 73
'
Format Profile 2
.Profile(2).YScale
= 1
.Profile(2).LineOption
= loCustom
.Profile(2).LineWidth
= woThreePoint
.Profile(2).LineStyle
= soSolid
.Profile(2).MarkerOption
= loNone
.Profile(2).LineColor
= RGB(255, 0, 0)
.Profile(2).Label
= "COSINE"
.Profile(2).NumSamples
= 73
'
Generate Sine and Cosine profiles
Dim
DataArray() As Variant
ReDim
DataArray(1 To .Profile(1).NumSamples, 1 To 2 * .NumProfiles)
Dim
Row As Integer
Const
pi As Double = 3.14159265358979
For
Row = 1 To .Profile(1).NumSamples
'
Profile 1
DataArray(Row,
1) = (Row - 1) / .Profile(1).NumSamples * 2 * pi
DataArray(Row,
2) = Sin((Row - 1) / .Profile(1).NumSamples * 2 * pi)
'
Profile 2
DataArray(Row,
3) = (Row - 1) / .Profile(1).NumSamples * 2 * pi
DataArray(Row,
4) = Cos((Row - 1) / .Profile(1).NumSamples * 2 * pi)
Next
Row
'
Feed source array into XYChart
.Chartdata
= DataArray
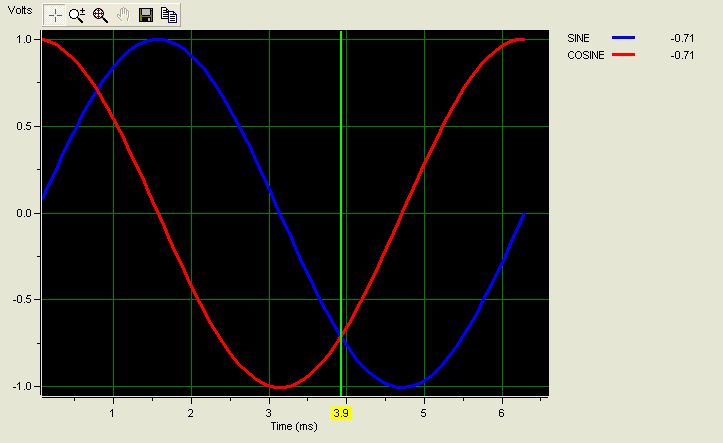
' Format Crosshairs
.CrossHairs.YCoordInLegend
= True
.CrossHairs.Color
= RGB(0, 255, 0)
.CrossHairs.Width
= woTwoPoint
.CrossHairs.CoordsBackcolor
= vbYellow
.CrossHairs.HorizontalVisible
= False
.CrossHairs.VerticalVisible
= True
'
Scale modes
.YScale(1).ScaleMode
= smAuto
.XScale(1).ScaleMode
= smAuto
.Refresh
End
With
End Sub
' Resize Event
Private Sub Form_Resize()
With
XYChart4Ctl1
.Left
= 0
.Top
= 0
.Width
= Me.ScaleWidth
.Height
= Me.ScaleHeight
.Refresh
End
With
End Sub
|