XY Chart NET 3 Control Reference
Sample 1: 2 Profiles, 1 X-Scale, 1 Y-Scale,
Toolbar & Legend
| XY Chart NET 3 Control Reference > Samples > Sample 1: 2 Profiles, 1 X-Scale, 1 Y-Scale, Toolbar & Legend |
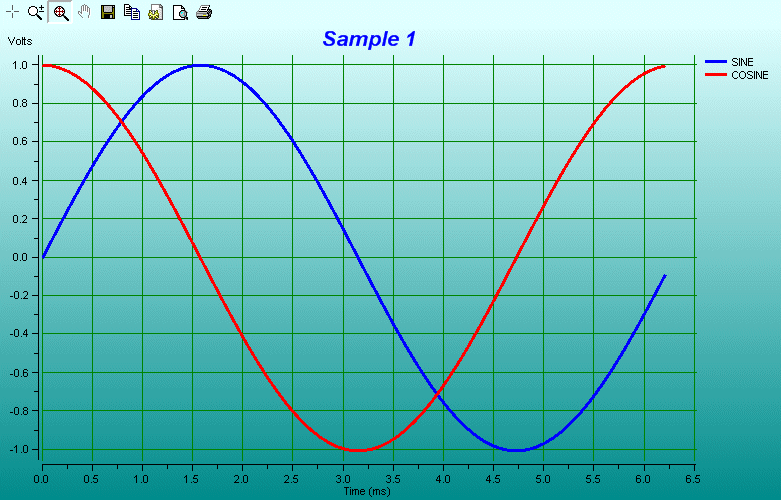
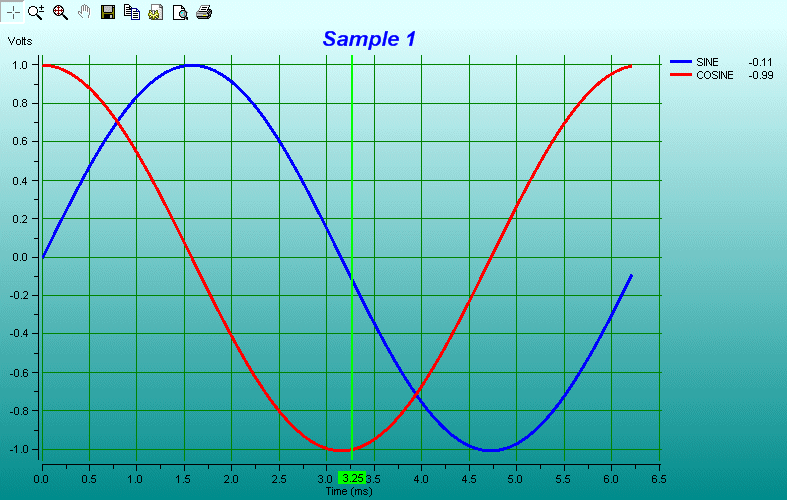
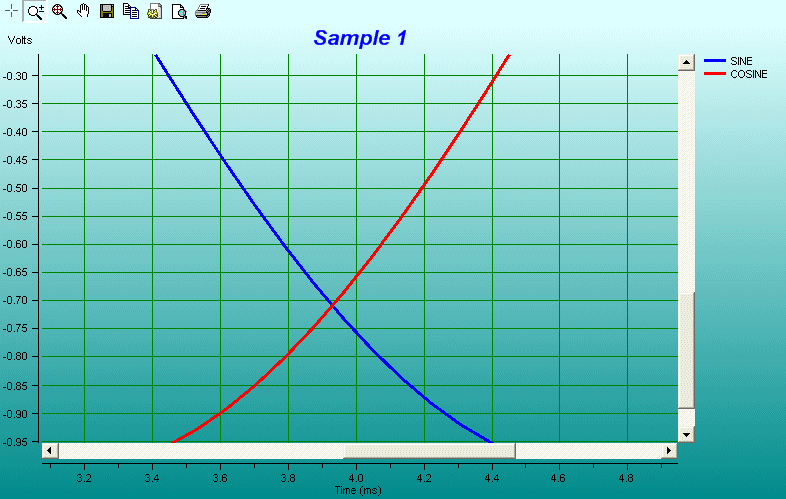
This sample demonstrates a basic chart showing Sine and Cosine profiles. Snapshots of the resulting chart are included below.
To test this code, the trial or full version of XY Chart NET must be installed on your computer.
Private Sub Form1_Load(ByVal sender As System.Object, ByVal e As System.EventArgs) Handles MyBase.Load
   Dim DataArray(,) As Double
   Dim Row As Integer
   Dim myFont As New Font("Arial", 16, FontStyle.Italic Or FontStyle.Bold)

   Const pi As Double = 3.14159265358979

   ' Configure XY Chart NET control
   With XyChartNETCtl1
      .NumProfiles = 2
      .NumXScales = 1
      .NumYScales = 1

      .Title.Label = "Sample 1"
      .Title.Font = myFont
      .Title.Color = Color.Blue

      ' Zoom window
      .ZoomWindowColor = Color.Yellow

      ' Gradient
      .Gradient.GradientOption = XYChartNet.XYChartNETCtl.GradientOptions.goCustom
      .Gradient.StartColor = Color.LightCyan
      .Gradient.EndColor = Color.DarkCyan
      .Gradient.Orientation = XYChartNet.XYChartNETCtl.OrientationOptions.ooVertical

      'Plot formatting
      .Plot.Transparent = True
      .Plot.Border.LineOption = XYChartNet.XYChartNETCtl.LineOptions.loNone

      ' Toolbar
      .Toolbar.Visible = True
      .Toolbar.BackColor = Color.LightCyan
      .Toolbar.Dock = XYChartNet.XYChartNETCtl.PositionOptions.poTop

      ' Format Legend
      .Legend.Visible = True
      .Legend.BorderVisible = False
      .Legend.YScaleVisible = False

      ' Format grid lines
      With .XAxis(0).Grid
         .LineOption = XYChartNet.XYChartNETCtl.LineOptions.loCustom
         .LineColor = Color.Green
      End With
      With .YAxis(0).Grid
         .LineOption = XYChartNet.XYChartNETCtl.LineOptions.loCustom
         .LineColor = Color.Green
      End With

      ' X Scale
      With .XAxis(0).Scale
         .Label = "Time (ms)"
         .LabelColor = Color.Black
         .TicksColor = Color.Black
      End With

      ' Y Scale
      With .YAxis(0).Scale
         .Visible = True
         .Label = "Volts"
         .LabelColor = Color.Black
         .TicksColor = Color.Black
      End With

      ' Format Profile 0
      With .Profile(0)
         .YScale = 0
         .LineOption = XYChartNet.XYChartNETCtl.LineOptions.loCustom
         .LineWidth = XYChartNet.XYChartNETCtl.WidthOptions.woThreePoint
         .LineStyle = XYChartNet.XYChartNETCtl.StyleOptions.soSolid
         .MarkerOption = XYChartNet.XYChartNETCtl.LineOptions.loNone
         .LineColor = Color.Blue
         .Label = "SINE"
         .NumSamples = 73
      End With

      ' Format Profile 1
      With .Profile(1)
         .YScale = 0
         .LineOption = XYChartNet.XYChartNETCtl.LineOptions.loCustom
         .LineWidth = XYChartNet.XYChartNETCtl.WidthOptions.woThreePoint
         .LineStyle = XYChartNet.XYChartNETCtl.StyleOptions.soSolid
         .MarkerOption = XYChartNet.XYChartNETCtl.LineOptions.loNone
         .LineColor = Color.Red
         .Label = "COSINE"
         .NumSamples = 73
      End With

      ' Generate Sine and Cosine profiles
      ReDim DataArray(.Profile(0).NumSamples - 1, 2 * .NumProfiles - 1)
      For Row = 0 To .Profile(0).NumSamples - 1
         ' Profile 0
         DataArray(Row, 0) = (Row) / .Profile(0).NumSamples * 2 * pi
         DataArray(Row, 1) = Math.Sin((Row) / .Profile(0).NumSamples * 2 * pi)

         ' Profile 1
         DataArray(Row, 2) = (Row) / .Profile(1).NumSamples * 2 * pi
         DataArray(Row, 3) = Math.Cos((Row) / .Profile(1).NumSamples * 2 * pi)
      Next Row

      ' Feed source array into XYChart
      .ChartData = DataArray

      ' Format Crosshairs
      With .Crosshairs
         .YCoordInLegend = True
         .Color = Color.Lime
         .Width = XYChartNet.XYChartNETCtl.WidthOptions.woTwoPoint
         .CoordsBackcolor = Color.Lime
         .HorizontalVisible = False
         .VerticalVisible = True
      End With

      ' Scale modes
      .XAxis(0).Scale.ScaleMode = XYChartNet.XYChartNETCtl.ScaleModes.smAuto
      .YAxis(0).Scale.ScaleMode = XYChartNet.XYChartNETCtl.ScaleModes.smAuto

      .Refresh()
   End With
End Sub


'Resize Event
Private Sub Form1_Resize(ByVal sender As Object, ByVal e As System.EventArgs) Handles MyBase.Resize
   With XyChartNETCtl1
      .Left = 0
      .Top = 0
      .Width = Me.ClientRectangle.Width
      .Height = Me.ClientRectangle.Height
   End With
End Sub
// NOTE:  Set the XYChartNET control's Anchor property to 'Top, Bottom, Left, Right'.
// Add the following code after the call to InitializeComponent in public Form1()

    const double pi = 3.14159265358979;
    const int    myNumSamples = 73;
    const int    myXYSet = 4;

    double     val;
    double [,] DataArray = new double [myNumSamples, myXYSet];
    Font       myFont    = new Font("Arial", 16, FontStyle.Bold | FontStyle.Italic);

    // Configure XY Chart NET control
    XYChartNETCtl1.NumProfiles = 2;
    XYChartNETCtl1.NumXScales = 1;
    XYChartNETCtl1.NumYScales = 1;

    XYChartNETCtl1.Title.Label = "Sample 1";
    XYChartNETCtl1.Title.Font = myFont;
    XYChartNETCtl1.Title.Color = Color.Blue;

    // Zoom window
    XYChartNETCtl1.ZoomWindowColor = Color.Yellow;

    // Gradient
    XYChartNETCtl1.Gradient.GradientOption = XYChartNet.XYChartNETCtl.GradientOptions.goCustom;
    XYChartNETCtl1.Gradient.StartColor = Color.LightCyan;
    XYChartNETCtl1.Gradient.EndColor = Color.DarkCyan;
    XYChartNETCtl1.Gradient.Orientation = XYChartNet.XYChartNETCtl.OrientationOptions.ooVertical;

    // Plot formatting
    XYChartNETCtl1.Plot.Transparent = true;
    XYChartNETCtl1.Plot.Border.LineOption = XYChartNet.XYChartNETCtl.LineOptions.loNone;

    // Toolbar
    XYChartNETCtl1.Toolbar.Visible = true;
    XYChartNETCtl1.Toolbar.BackColor = Color.LightCyan;
    XYChartNETCtl1.Toolbar.Dock = XYChartNet.XYChartNETCtl.PositionOptions.poTop;

    // Format Legend
    XYChartNETCtl1.Legend.Visible = true;
    XYChartNETCtl1.Legend.BorderVisible = false;
    XYChartNETCtl1.Legend.YScaleVisible = false;

    // X Axis Grid & Scale properties
    XYChartNet.XYChartNETCtl.XSCALEPROP xAxis;
    xAxis = XYChartNETCtl1.get_XAxis(0);
    xAxis.Grid.LineOption = XYChartNet.XYChartNETCtl.LineOptions.loCustom;
    xAxis.Grid.LineColor = Color.Green;
    xAxis.Scale.Label = "Time (ms)";
    xAxis.Scale.LabelColor = Color.Black;
    xAxis.Scale.TicksColor = Color.Black;
    xAxis.Scale.ScaleMode = XYChartNet.XYChartNETCtl.ScaleModes.smAuto;

    // Y Axis Grid & Scale properties
    XYChartNet.XYChartNETCtl.YSCALEPROP yAxis;
    yAxis = XYChartNETCtl1.get_YAxis(0);
    yAxis.Grid.LineOption = XYChartNet.XYChartNETCtl.LineOptions.loCustom;
    yAxis.Grid.LineColor = Color.Green;
    yAxis.Scale.Label = "Volts";
    yAxis.Scale.LabelColor = Color.Black;
    yAxis.Scale.TicksColor = Color.Black;
    yAxis.Scale.ScaleMode = XYChartNet.XYChartNETCtl.ScaleModes.smAuto;

    XYChartNet.XYChartNETCtl.C_Profile profile;

    // Format Profile 0
    profile = XYChartNETCtl1.get_Profile(0);
    profile.YScale = 0;
    profile.LineOption = XYChartNet.XYChartNETCtl.LineOptions.loCustom;
    profile.LineWidth = XYChartNet.XYChartNETCtl.WidthOptions.woThreePoint;
    profile.LineStyle = XYChartNet.XYChartNETCtl.StyleOptions.soSolid;
    profile.MarkerOption = XYChartNet.XYChartNETCtl.LineOptions.loNone;
    profile.LineColor = Color.Blue;
    profile.Label = "SINE";
    profile.NumSamples = myNumSamples;

    // Format Profile 1
    profile = XYChartNETCtl1.get_Profile(1);
    profile.YScale = 0;
    profile.LineOption = XYChartNet.XYChartNETCtl.LineOptions.loCustom;
    profile.LineWidth = XYChartNet.XYChartNETCtl.WidthOptions.woThreePoint;
    profile.LineStyle = XYChartNet.XYChartNETCtl.StyleOptions.soSolid;
    profile.MarkerOption = XYChartNet.XYChartNETCtl.LineOptions.loNone;
    profile.LineColor = Color.Red;
    profile.Label = "COSINE";
    profile.NumSamples = myNumSamples;

    // Generate Sine and Cosine profiles
    for (int row = 0; row < myNumSamples; row++)
    {
        // Profile 0
        val = 2 * pi * row / myNumSamples;
        DataArray[row, 0] = val;
        DataArray[row, 1] = Math.Sin(val);

        // Profile 1
        DataArray[row, 2] = val;
        DataArray[row, 3] = Math.Cos(val);
    }

    // Feed source array into XYChart
    XYChartNETCtl1.ChartData = DataArray;

    // Format Crosshairs
    XYChartNETCtl1.Crosshairs.YCoordInLegend = true;
    XYChartNETCtl1.Crosshairs.Color = Color.Lime;
    XYChartNETCtl1.Crosshairs.Width = XYChartNet.XYChartNETCtl.WidthOptions.woTwoPoint;
    XYChartNETCtl1.Crosshairs.CoordsBackcolor = Color.Lime;
    XYChartNETCtl1.Crosshairs.HorizontalVisible = false;
    XYChartNETCtl1.Crosshairs.VerticalVisible = true;

    XYChartNETCtl1.Refresh();
// NOTE:  Set the XYChartNET control's Anchor property to 'Top, Bottom, Left, Right'.
// Add the following code after the call to InitializeComponent in public Form1()

    const double pi = 3.14159265358979;
    const int    myNumSamples = 73;
    const int    myXYSet = 4;

    double                  DataArray __gc[,] = new double __gc[myNumSamples, myXYSet];
    double                  dataValue;
    int                     myFontStyle = (int)Drawing::FontStyle::Bold | (int)Drawing::FontStyle::Italic;
    System::Drawing::Font*  myFont = new Drawing::Font("Arial", 16, (Drawing::FontStyle)myFontStyle);

    // Configure XY Chart NET control
    XYChartNETCtl1->NumProfiles = 2;
    XYChartNETCtl1->NumXScales = 1;
    XYChartNETCtl1->NumYScales = 1;

    XYChartNETCtl1->Title->Label = "Sample 1";
    XYChartNETCtl1->Title->Font = myFont;
    XYChartNETCtl1->Title->Color = Color::Blue;

    // Zoom window
    XYChartNETCtl1->ZoomWindowColor = Color::Yellow;

    // Gradient
    XYChartNETCtl1->Gradient->GradientOption = XYChartNETCtl::GradientOptions::goCustom;
    XYChartNETCtl1->Gradient->StartColor = Color::LightCyan;
    XYChartNETCtl1->Gradient->EndColor = Color::DarkCyan;
    XYChartNETCtl1->Gradient->Orientation = XYChartNETCtl::OrientationOptions::ooVertical;

    // Plot formatting
    XYChartNETCtl1->Plot->Transparent = true;
    XYChartNETCtl1->Plot->Border->LineOption = XYChartNETCtl::LineOptions::loNone;

    // Toolbar
    XYChartNETCtl1->Toolbar->Visible = true;
    XYChartNETCtl1->Toolbar->BackColor = Color::LightCyan;
    XYChartNETCtl1->Toolbar->Dock = XYChartNETCtl::PositionOptions::poTop;

    // Format Legend
    XYChartNETCtl1->Legend->Visible = true;
    XYChartNETCtl1->Legend->BorderVisible = false;
    XYChartNETCtl1->Legend->YScaleVisible = false;

    // Format grid lines
    XYChartNETCtl1->get_XAxis(0).Grid->LineOption = XYChartNETCtl::LineOptions::loCustom;
    XYChartNETCtl1->get_XAxis(0).Grid->LineColor = Color::Green;
    XYChartNETCtl1->get_YAxis(0).Grid->LineOption = XYChartNETCtl::LineOptions::loCustom;
    XYChartNETCtl1->get_YAxis(0).Grid->LineColor = Color::Green;

    // X Scale
    XYChartNETCtl1->get_XAxis(0).Scale->Label = "Time (ms)";
    XYChartNETCtl1->get_XAxis(0).Scale->LabelColor = Color::Black;
    XYChartNETCtl1->get_XAxis(0).Scale->TicksColor = Color::Black;

    // Y Scale
    XYChartNETCtl1->get_YAxis(0).Scale->Label = "Volts";
    XYChartNETCtl1->get_YAxis(0).Scale->LabelColor = Color::Black;
    XYChartNETCtl1->get_YAxis(0).Scale->TicksColor = Color::Black;

    // Format Profile 0
    XYChartNETCtl1->get_Profile(0)->YScale = 0;
    XYChartNETCtl1->get_Profile(0)->LineOption = XYChartNETCtl::LineOptions::loCustom;
    XYChartNETCtl1->get_Profile(0)->LineWidth = XYChartNETCtl::WidthOptions::woThreePoint;
    XYChartNETCtl1->get_Profile(0)->LineStyle = XYChartNETCtl::StyleOptions::soSolid;
    XYChartNETCtl1->get_Profile(0)->MarkerOption = XYChartNETCtl::LineOptions::loNone;
    XYChartNETCtl1->get_Profile(0)->LineColor = Color::Blue;
    XYChartNETCtl1->get_Profile(0)->Label = "SINE";
    XYChartNETCtl1->get_Profile(0)->NumSamples = myNumSamples;

    // Format Profile 1
    XYChartNETCtl1->get_Profile(1)->YScale = 0;
    XYChartNETCtl1->get_Profile(1)->LineOption = XYChartNETCtl::LineOptions::loCustom;
    XYChartNETCtl1->get_Profile(1)->LineWidth = XYChartNETCtl::WidthOptions::woThreePoint;
    XYChartNETCtl1->get_Profile(1)->LineStyle = XYChartNETCtl::StyleOptions::soSolid;
    XYChartNETCtl1->get_Profile(1)->MarkerOption = XYChartNETCtl::LineOptions::loNone;
    XYChartNETCtl1->get_Profile(1)->LineColor = Color::Red;
    XYChartNETCtl1->get_Profile(1)->Label = "COSINE";
    XYChartNETCtl1->get_Profile(1)->NumSamples = myNumSamples;

    // Generate Sine and Cosine profiles
    for (int row = 0; row < myNumSamples; row++)
    {
        dataValue = (double)row / (double)myNumSamples * 2 * pi;

        // Profile 0
        DataArray[row, 0] = dataValue;
        DataArray[row, 1] = Math::Sin(dataValue);

        // Profile 1
        DataArray[row, 2] = dataValue;
        DataArray[row, 3] = Math::Cos(dataValue);
    }

    // Feed source array into XYChart
    XYChartNETCtl1->ChartData = DataArray;

    // Format Crosshairs
    XYChartNETCtl1->Crosshairs->YCoordInLegend = true;
    XYChartNETCtl1->Crosshairs->Color = Color::Lime;
    XYChartNETCtl1->Crosshairs->Width = XYChartNETCtl::WidthOptions::woTwoPoint;
    XYChartNETCtl1->Crosshairs->CoordsBackcolor = Color::Lime;
    XYChartNETCtl1->Crosshairs->HorizontalVisible = false;
    XYChartNETCtl1->Crosshairs->VerticalVisible = true;

    // Scale modes
    XYChartNETCtl1->get_XAxis(0).Scale->ScaleMode = XYChartNETCtl::ScaleModes::smAuto;
    XYChartNETCtl1->get_YAxis(0).Scale->ScaleMode = XYChartNETCtl::ScaleModes::smAuto;

    XYChartNETCtl1->Refresh();