| Version |
Lite |
Pro |
| Max Y scales with left or right placement |
2 |
100 |
| Max X scales with top or bottom placement |
2 |
100 |
| Max Y scale stacks more »
|
2 |
100 |
| Max profiles |
1,000 |
250,000 |
| Max samples per profile |
5,000 |
1,000,000 |
| Profile fill more » |
|
 |
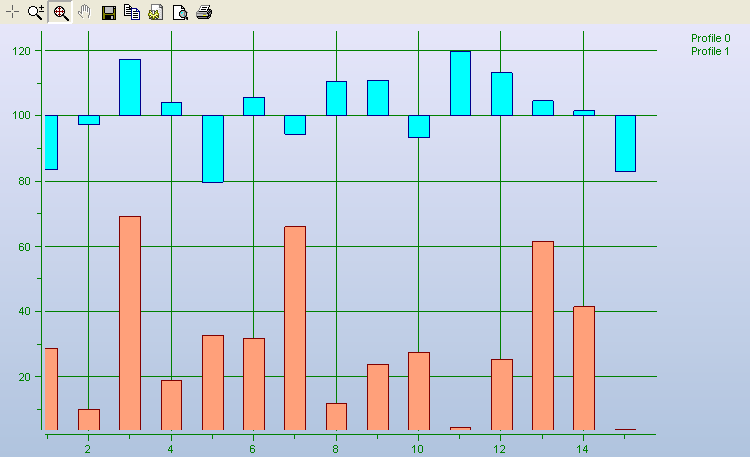
| Bar charts, horizontal & vertical more » |
|
|
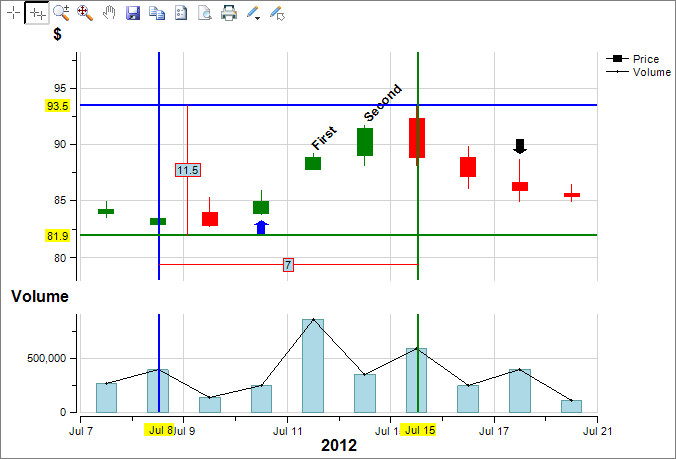
| Financial charts (time series, candles, buy/sell, recession) more » |
|
|
| Linear and Log scales with full font support |
|
|
| Trending more » |
|
|
| Inverted scales more » |
|
|
| X & Y value for each data point |
|
|
| Built-in zoom, scrollbars and pan more » |
|
|
| Crosshairs and coordinates display more » |
|
|
| Profile interpolation |
|
|
| Linear |
|
|
| Cardinal spline more » |
|
|
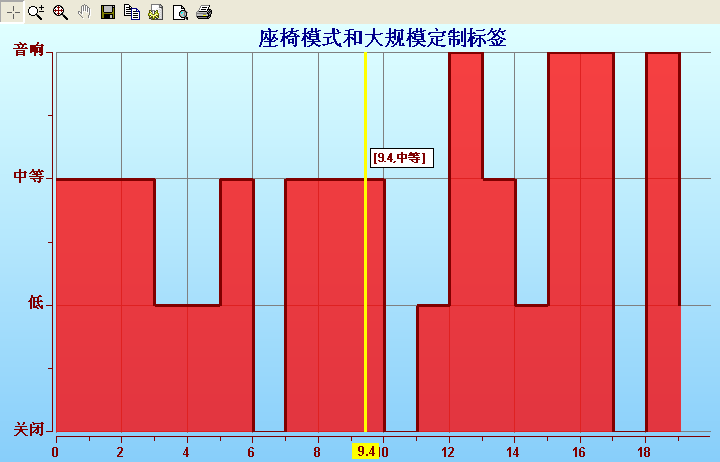
| Stair Mode more » |
|
|
| Boolean more » |
|
|
| Hatching more » |
|
|
| Annotations |
|
|
|
Chart gradient support with plot transparency option more » |
|
|
|
Font and gradient support for all labels |
|
|
| Pass data point-by-point |
|
|
| Pass entire arrays directly for best performance with a lot of data |
|
|
| Inheritance to extend all chart classes |
|
|
| Auto & manual scale modes for all scales |
|
|
|
Manually set each scale's major tick interval |
|
|
| DateTime formatting down to ms more » |
|
|
| Units support for each scale more » |
|
|
| Grid for each scale |
|
|
| Pan individual scales when no scrollbars |
|
|
| Legend with scrolling when needed |
|
|
| Coordinates available programmatically |
|
|
| Null data points for breaks in a profile more » |
|
|
| Full unicode support more » |
|
|
| Built-in Toolbar |
|
|
| Position toolbar at left, top, right or bottom of chart |
|
|
| Show or hide any toolbar button |
|
|
| Hide the toolbar and use your own custom toolbar more » |
|
|
| Set toolbar tooltips for multiple languages |
|
|
| Global number and date time formatting |
|
|
| Print Preview and Printing more » |
|
|
| Full documentation help and sample code more » |
|
|
| Save chart image to BMP, EMF, EXIF, GIF, JPEG, PNG, TIFF, WMF |
|
|
| Copy chart image to clipboard |
|
|
| Export chart data to tab delimited text file |
|
|
| Flickerless display, even when resizing |
|
|
| Error log file for detailed debugging
|
|
|
