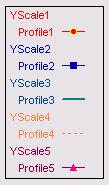
Legend

The display and format of the legend is user controlled through its
Legend property setting, or
via its Legend fields in the
General Property Page.
The legend displays useful information such as:
- which Profile is
plotted against which Y-axis scale
- configured label for
each Profile (labels - Profile1, Profile2, Profile3, Profile4, and Profile5 - are used in the
figure above)
- configured line type
and marker for each Profile
- Y-axis scale labels (YScale1, YScale2, YScale3, YScale4, and YScale5 are used in the figure above)
- the profile labels are displayed in the same color as its
y-axis scale
- Y-axis scale colors
NOTE: If a Y-axis scale label is empty, it will not be displayed in the legend.