
XYChart News
- XY Chart NET v3 Released!
Nov 21, 2012
XY Chart NET provides developers with a powerful
easy-to-use chart component that integrates seamlessly into your Visual Studio .NET WinForms applications. XY Chart NET is ideally suited for technical and financial applications as well as general application development, and is being used all over the world in a broad range of applications including scientific lab measurements, financial data, motion control, process monitoring, industrial automation, education and research, etc.
Automatic Built-in Functions
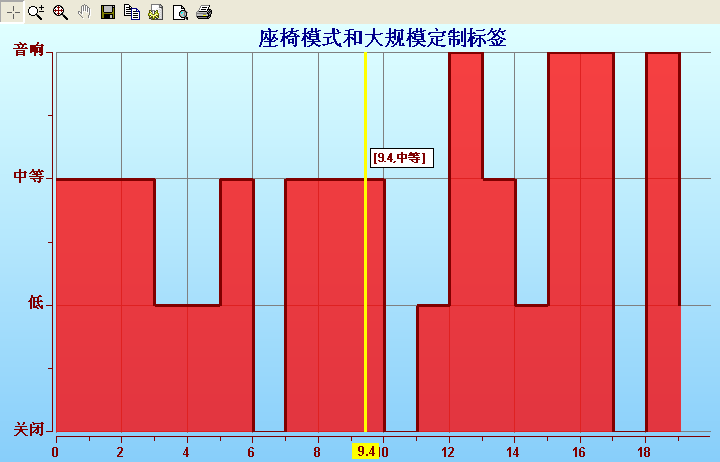
Automatic built-in functions such as zoom, scrollbars and pan, crosshairs, delta crosshairs and coordinates display, annotations, and legend with profile values, all of which require no coding and allow users to analyze charts with ease and precision.
Ideal for Global Applications
Supports multiple languages, localizeable, with settable toolbar tooltips, full unicode support, and global number and date time formatting down to ms.
Designed for Challenging Technical Applications
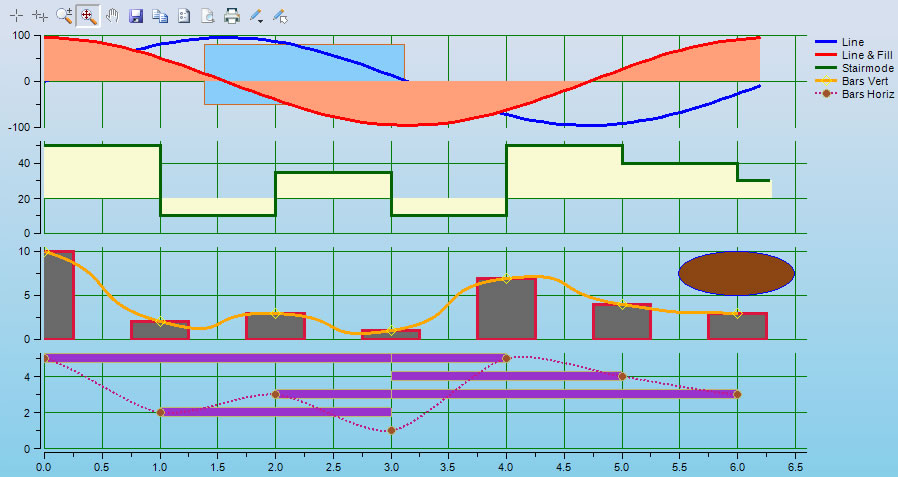
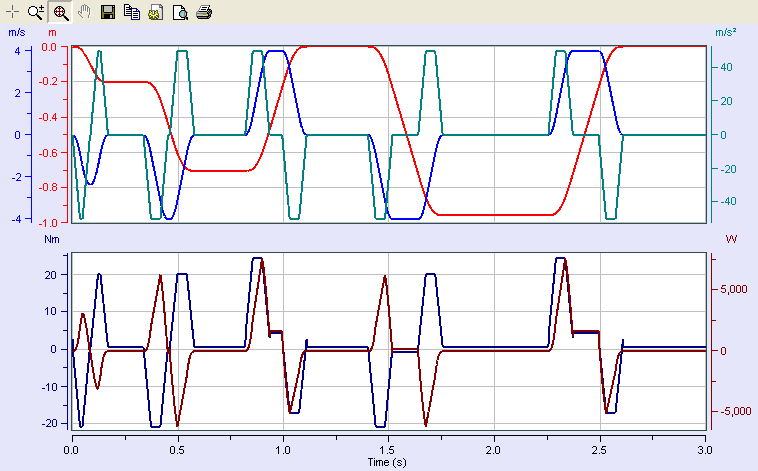
Create detailed charts with up to 100 X scales, 100 Y scales and 100 Y stacks. Build trending applications with multiple scales. Easily add multiple units support for any X or Y scale using right-click drop down menus.
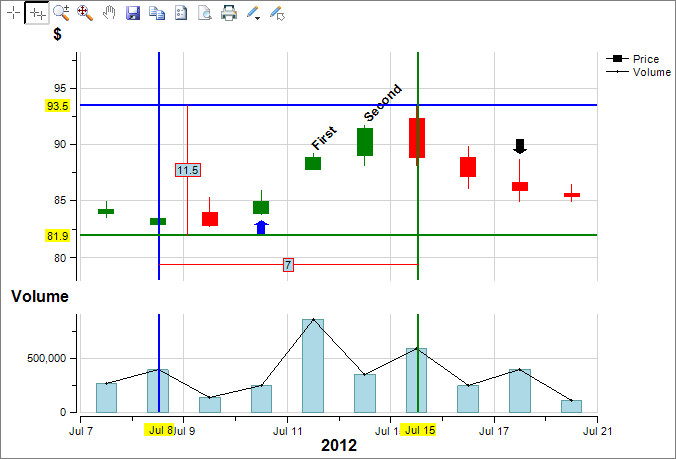
Financial and Economic Charts, Flexible and Highly Customizable
Several chart types including time series, candles, buy/sell, recession, line, xy scatter, point/markers, column/bar, and stacked column/bar. Configure the appearance of almost everything such as colors, gradients, borders and line styles, etc. Even supports layering of custom graphic objects.