
XY Chart NET FAQ
1. System Requirements
XY Chart NET v3 is a .NET Winforms library that can be embedded in your Visual Studio .NET Winforms project. The development machine system requirements are:
- Visual Studio .NET 2008 - 2019 Winforms
- .NET Framework 2.0, 3.5, 4.0 and 4.5
- Programming language (VB.NET, C#.NET, C/C++.NET)
- Windows XP / Vista / 7 / 8 / 8.1 / 10, 32 or 64-bit
2. Installing from a Download
If you downloaded the trial version, no registration key is required. Simply run the installation. After 5 minutes, XY Chart NET will stop working and a message box will appear. Simply, stop and restart the application, and XY Chart NET will work for another 5 minutes.
Once you have purchased a license, you will be given a unique registration key and License file specific to your PC, which will enable the Full version.
Step 1: Install XYChartNET
- Run setup.exe from the application's installation package
Step 2: Enabe XYChartNET Component
- Open an existing Visual Studio project.
- Activate any form "[Design]" window.
- Open the Visual Studio Toolbox.
- Right-click on the mouse over any item in the Toolbox and select Add Tab.
- Enter "ControlEng" as the tab name.
- Open Windows Explorer and navigate to XYChartNET's installation folder.
- Select XYChartNet.dll and drag the item onto the newly created tab.
- XYChartNET component is now available for use.
Step 3: Uninstall XYChartNET
- Launch 'Add or Remove Programs' (via Start > Settings > Control Panel).
- Select program to remove, 'XY Chart NET'.
- Click on Remove.
- Open an existing Visual Studio project.
- Activate any form "[Design]" window.
- Open the Visual Studio Toolbox.
- Select "ControlEng" tab, right-click on the mouse and select Delete Tab.
- XYChartNET component is uninstalled from system.
3. Distributing XY Chart NET for runtime applications
- XY Chart NET v3 is a standalone product and does not require any other files to be installed other than the appropriate Microsoft .NET 2.0, 3.5, 4.0 or 4.5 Framework. The Microsoft .NET Framework Runtime is available for download at Microsoft's web site.
- Copy the XYChartNetFWX_Y.dll file to the same directory as your main executable. Note that X and Y denote the framework version. Eg. The file for .NET Framework v4.5 is XYChartNetFW4_5.dll.
- If using the language localization file, XYNLangTableUE.xml, then it also must be copied to the same directory as your main executable.
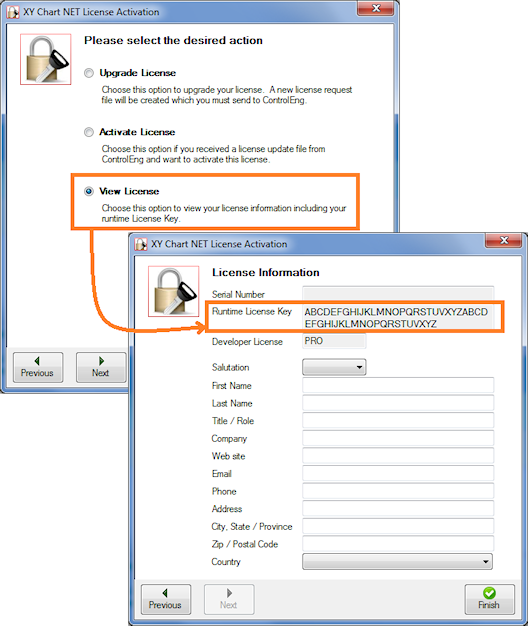
- In your application, set your Runtime License Key. The LicenseKey property is an application Global variable, meaning you only need to set it once for one instanceof XY Chart NET. And then it applies to all XY Chart NET instances in your application.
You can get your Runtime License Key in the License Activation Wizard as shown...
4 . If I compile my program and distribute only the XYChartNet.dll file to my customers, do I have to pay royalties?
No. Runtime distribution licenses are free. Specifically, if you only distribute the XYChartNet.dll file and do not allow your customers to develop software using XY Chart NET, then there are no runtime royalties.
If your customers can develop software using XY Chart NET, then this is effectively giving them a developer license. Therefore, in this case, a developer license must be purchased.
5 . What is the maximum size of the ChartData array?
All arrays are 0-based. The maximum number of profiles is 250000. Every point in every profile requires an X and Y value. Hence, the maximum number of columns is 2 x 250000 profiles = 500000 columns. The maximum number of samples per profile is 1000000. Therefore, the maximum size of the ChartData array is 500000 columns x 1000000 rows (see table below).
6. What is automatic zoom, scrollbars, pan, crosshairs and coordinates?
Automatic is exactly that. No programming is required. By enabling the XY Chart NET toolbar, the zoom, scrollbars, pan, crosshairs, and coordinates display functions are automatically available to the user.
7. What is the maximum number of Y scales, X scales and profiles?
Up to 100 Y scales and 100 X scales are available. Up to 250,000 profiles can be mapped to any of the 100 Y scales and 100 X scales.
8. Can a number of profiles be displayed while their corresponding Y Scale is not?
Yes. Each Y Scale can be made visible or hidden independent of the profiles mapped to it. The toolbar can also be hidden. This is usually done to save space, allowing the plot area to be larger. All scaling functions continue to work as though the Y Scale is displayed. See sample images below.
Scales and Toolbar Visible
Scales and Toolbar Hidden
9. How do I use DateTime formatting?
DateTime support allows the display of date and/or time values to be displayed on any X or Y axis. The DateTime format is implemented as a floating-point value (double), measuring days from midnight, December 30, 1899. So, midnight, December 31, 1899 is represented by 1.0. Similarly, 6 AM, January 1, 1900 is represented by 2.25.
Note that the '.fff' format denotes miliseconds, which is the smallest DateTime number format supported.
E.g. For a value of 38045.40279, the format strings below yield the following results:
| Format String | Result |
|---|---|
| h:mm:ss |
9:40:00 |
| hh:mm:ss.fff | 09:40:00.056 |
| hh:mm:ss tt | 09:40:00 AM |
| m/d/yy | 2/28/04 |
| dd-MMM-yyyy | 28-Feb-2004 |
| MMMM dd, yyyy hh:mm:ss tt | February 28, 2004 09:40:00 AM |
' The X scale formatting can also be set programitically as per the following:
With XYChart
.XScale(1).FormatStyle = fsDateTime
.XScale(1).DateTimeFormat = "dd-MMM-yyyy hh:mm:ss tt" ' X value = 38045.40279 will display 28-Feb-2004 09:40:00 AM
End With
10. How to I get data into XY Chart NET?
There are 3 methods available to pass data to XY Chart NET:
- Write each point individually using the Row, Col and Data properties
- The quickest for one or a few data points
- Slowest to change many data points
- See the Data example
- Feed one array for a single profile using ProfileData
- Passing an array is quicker when many data points
- Also useful when a single profile needs updating more frequently than the others
- See the ProfileData example
- Feed one array for all profiles using ChartData
- Passing an array is quicker when many data points
- The quickest when a lot of data points and most or all profiles have near the same NumSamples
- Also convenient if all or most data points change together
- See the ChartData example
The fasted way to pass a lot of data is using method 2 or 3. If all the values for all profiles need to be updated at the same time, then use method 3, where the dimension of the array equals the profile with the most samples - 1. If some profiles have fewer samples, then when the array is passed to the chart, it will only get the number of samples for that profile.
11. XY Chart NET v1.x Issues with Windows Vista & 7
Note: The following two issues only apply when the chart is being used in the development environment (Visual Studio IDE), which requires access to the Registry to manage the license. Runtime applications are not affected.
Issue 1: Administrator Rights
Note: This issue only applies to XY Chart NET v1.x, and does not apply to v3.
The install package is successfully downloaded and installed on a Windows Vista/7 machine with VS2005/8/10. Users are able to place the control in the Toolbox. But when the control is dragged and dropped on a Windows Form, the following error message occurs:
"Failed to create component 'XYChartNETCtl'. The error message follows:
System.Security.SecurityException: Requested registry access is not
allowed at System.ThrowHelper.ThrowSecurityException(..."
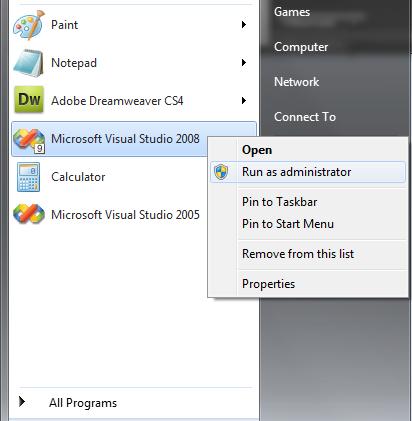
Cause: Administrator permissions are required in the IDE.
Solution: To run Visual Studio as an Administrator, right-click on Visual Studio and select "Run as Administrator" per the screenshot below. The control should drop on the form with no exceptions being generated.
Issue 2: 64-bit Systems
When running the Trial version on 64-bit systems, the following error message occurs:
"SetRegTimeStamp - Unable to open Registry Key"
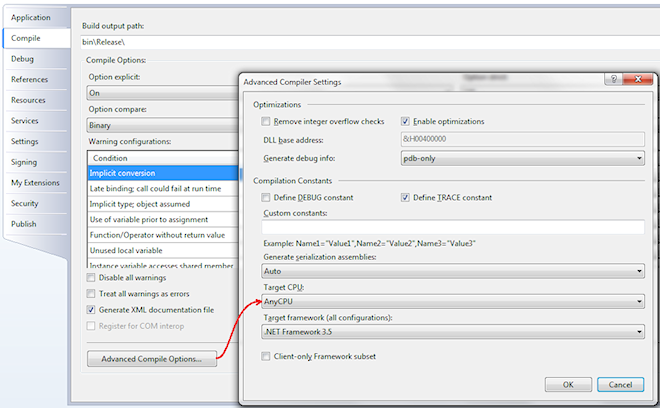
Cause: XY Chart NET is a 32-bit control. So the target CPU needs to be specified as "x86".
Solution: Open the project properties, select the "Compile" tab, then click on the "Advanced Compile Options" button. Set the Target CU to x86, per the screenshot below.
12. When using XY Chart NET v1.x, when I press F1 in the development environment, context sensitive help is not working
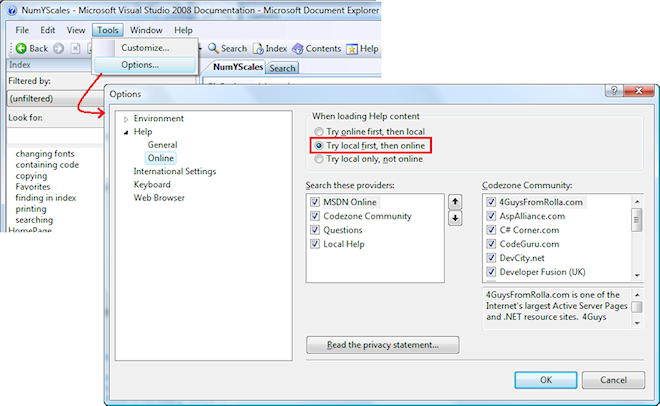
It is just a simple change in settings in the Microsoft Document Explorer. Select 'Tools > Options', and then
in the 'Online' settings, change to 'Try local first, then online'.
13. Unable to Resolve License error when upgrading from v1 to v3
Description: After upgrading application to use new XY Chart NET v3 control, compilation fails with error "Unable to resolve type 'XYChartNET.XYChartNETCtl, XYChartNET, Version=1.x.x.x, Culture=neutral, PublicKeyToken=null'".
Resolution: XY Chart NET v3 does not require this file for licensing.
Perform the following steps to remove the dependency on this file:
- If your Visual Studio project is open, close it
- Edit the licenses.licx file (using Notepad for example)
- Remove the "XYChartNET" line from the licenses.licx file and save the file
- Open your Visual Studio project and recompile your application